Alsatian vs Immigrants from Colombia 6th Grade
COMPARE
Alsatian
Immigrants from Colombia
6th Grade
6th Grade Comparison
Alsatians
Immigrants from Colombia
97.1%
6TH GRADE
69.8/ 100
METRIC RATING
156th/ 347
METRIC RANK
96.4%
6TH GRADE
0.3/ 100
METRIC RATING
263rd/ 347
METRIC RANK
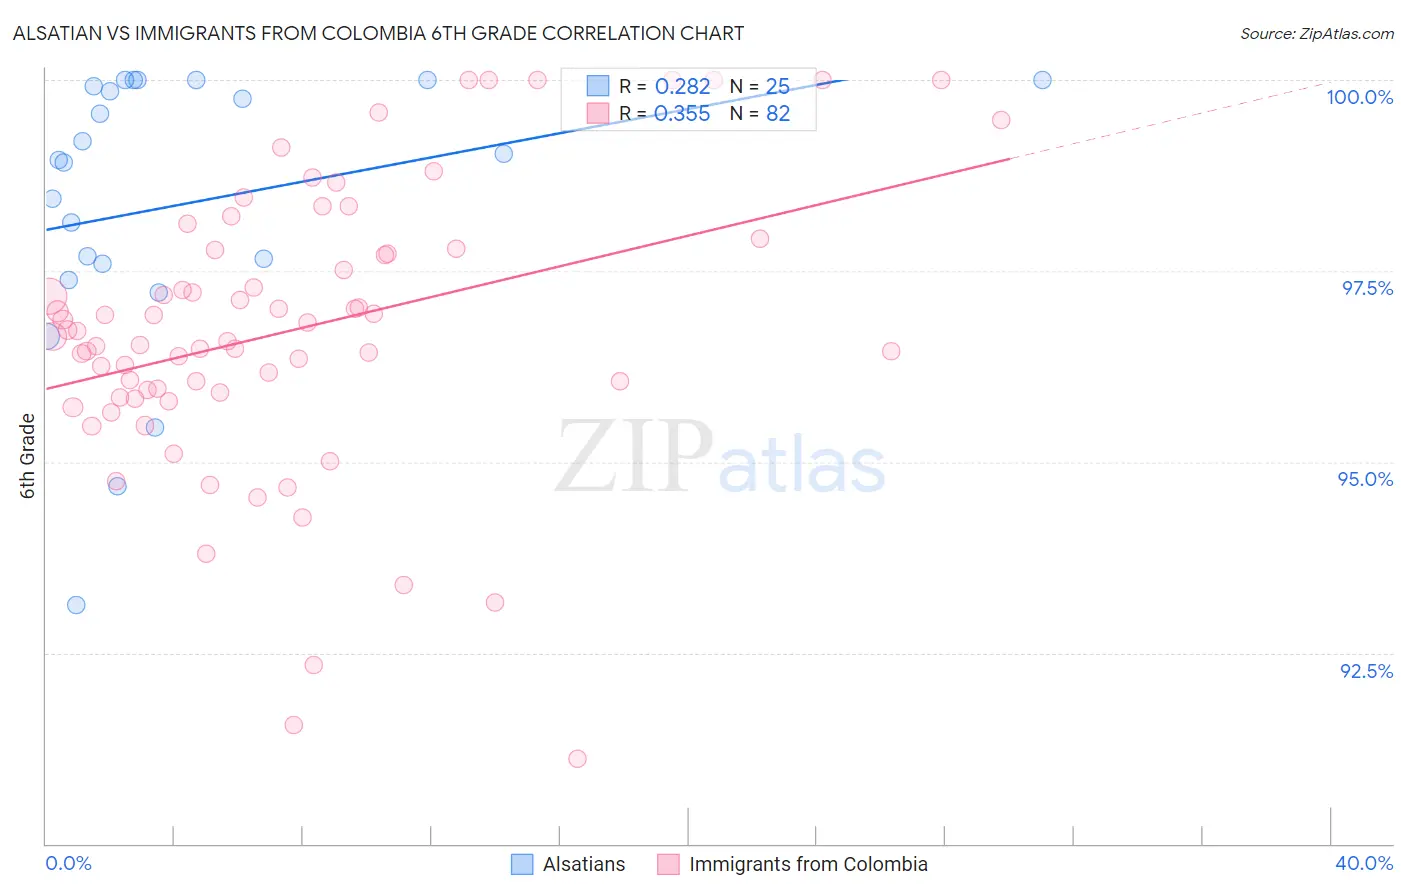
Alsatian vs Immigrants from Colombia 6th Grade Correlation Chart
The statistical analysis conducted on geographies consisting of 82,682,365 people shows a weak positive correlation between the proportion of Alsatians and percentage of population with at least 6th grade education in the United States with a correlation coefficient (R) of 0.282 and weighted average of 97.1%. Similarly, the statistical analysis conducted on geographies consisting of 378,598,469 people shows a mild positive correlation between the proportion of Immigrants from Colombia and percentage of population with at least 6th grade education in the United States with a correlation coefficient (R) of 0.355 and weighted average of 96.4%, a difference of 0.78%.
6th Grade Correlation Summary
| Measurement | Alsatian | Immigrants from Colombia |
| Minimum | 93.1% | 91.1% |
| Maximum | 100.0% | 100.0% |
| Range | 6.9% | 8.9% |
| Mean | 98.4% | 96.7% |
| Median | 98.9% | 96.7% |
| Interquartile 25% (IQ1) | 97.5% | 95.9% |
| Interquartile 75% (IQ3) | 100.0% | 97.8% |
| Interquartile Range (IQR) | 2.5% | 1.9% |
| Standard Deviation (Sample) | 1.8% | 1.9% |
| Standard Deviation (Population) | 1.8% | 1.8% |
Similar Demographics by 6th Grade
Demographics Similar to Alsatians by 6th Grade
In terms of 6th grade, the demographic groups most similar to Alsatians are Soviet Union (97.2%, a difference of 0.010%), Ute (97.1%, a difference of 0.010%), Immigrants from Russia (97.1%, a difference of 0.010%), French American Indian (97.2%, a difference of 0.020%), and Immigrants from Jordan (97.2%, a difference of 0.020%).
| Demographics | Rating | Rank | 6th Grade |
| Immigrants | Israel | 76.0 /100 | #149 | Good 97.2% |
| Immigrants | Bosnia and Herzegovina | 74.8 /100 | #150 | Good 97.2% |
| French American Indians | 74.0 /100 | #151 | Good 97.2% |
| Immigrants | Jordan | 73.0 /100 | #152 | Good 97.2% |
| Immigrants | Eastern Europe | 72.6 /100 | #153 | Good 97.2% |
| Soviet Union | 71.5 /100 | #154 | Good 97.2% |
| Ute | 71.1 /100 | #155 | Good 97.1% |
| Alsatians | 69.8 /100 | #156 | Good 97.1% |
| Immigrants | Russia | 67.6 /100 | #157 | Good 97.1% |
| Immigrants | Iran | 63.3 /100 | #158 | Good 97.1% |
| Kenyans | 62.9 /100 | #159 | Good 97.1% |
| Ugandans | 62.2 /100 | #160 | Good 97.1% |
| Immigrants | Belarus | 60.4 /100 | #161 | Good 97.1% |
| Marshallese | 60.2 /100 | #162 | Good 97.1% |
| Albanians | 57.8 /100 | #163 | Average 97.1% |
Demographics Similar to Immigrants from Colombia by 6th Grade
In terms of 6th grade, the demographic groups most similar to Immigrants from Colombia are Armenian (96.4%, a difference of 0.0%), Immigrants from Nigeria (96.4%, a difference of 0.010%), Immigrants from Jamaica (96.4%, a difference of 0.010%), Ghanaian (96.4%, a difference of 0.020%), and Afghan (96.4%, a difference of 0.020%).
| Demographics | Rating | Rank | 6th Grade |
| U.S. Virgin Islanders | 0.5 /100 | #256 | Tragic 96.5% |
| Taiwanese | 0.5 /100 | #257 | Tragic 96.5% |
| Immigrants | China | 0.4 /100 | #258 | Tragic 96.4% |
| South Americans | 0.4 /100 | #259 | Tragic 96.4% |
| Peruvians | 0.4 /100 | #260 | Tragic 96.4% |
| Immigrants | Sierra Leone | 0.4 /100 | #261 | Tragic 96.4% |
| Immigrants | Nigeria | 0.3 /100 | #262 | Tragic 96.4% |
| Immigrants | Colombia | 0.3 /100 | #263 | Tragic 96.4% |
| Armenians | 0.3 /100 | #264 | Tragic 96.4% |
| Immigrants | Jamaica | 0.2 /100 | #265 | Tragic 96.4% |
| Ghanaians | 0.2 /100 | #266 | Tragic 96.4% |
| Afghans | 0.2 /100 | #267 | Tragic 96.4% |
| Immigrants | Uzbekistan | 0.2 /100 | #268 | Tragic 96.3% |
| West Indians | 0.2 /100 | #269 | Tragic 96.3% |
| Immigrants | South America | 0.2 /100 | #270 | Tragic 96.3% |