Alsatian vs Sri Lankan Average Family Size
COMPARE
Alsatian
Sri Lankan
Average Family Size
Average Family Size Comparison
Alsatians
Sri Lankans
3.14
AVERAGE FAMILY SIZE
0.2/ 100
METRIC RATING
291st/ 347
METRIC RANK
3.35
AVERAGE FAMILY SIZE
100.0/ 100
METRIC RATING
57th/ 347
METRIC RANK
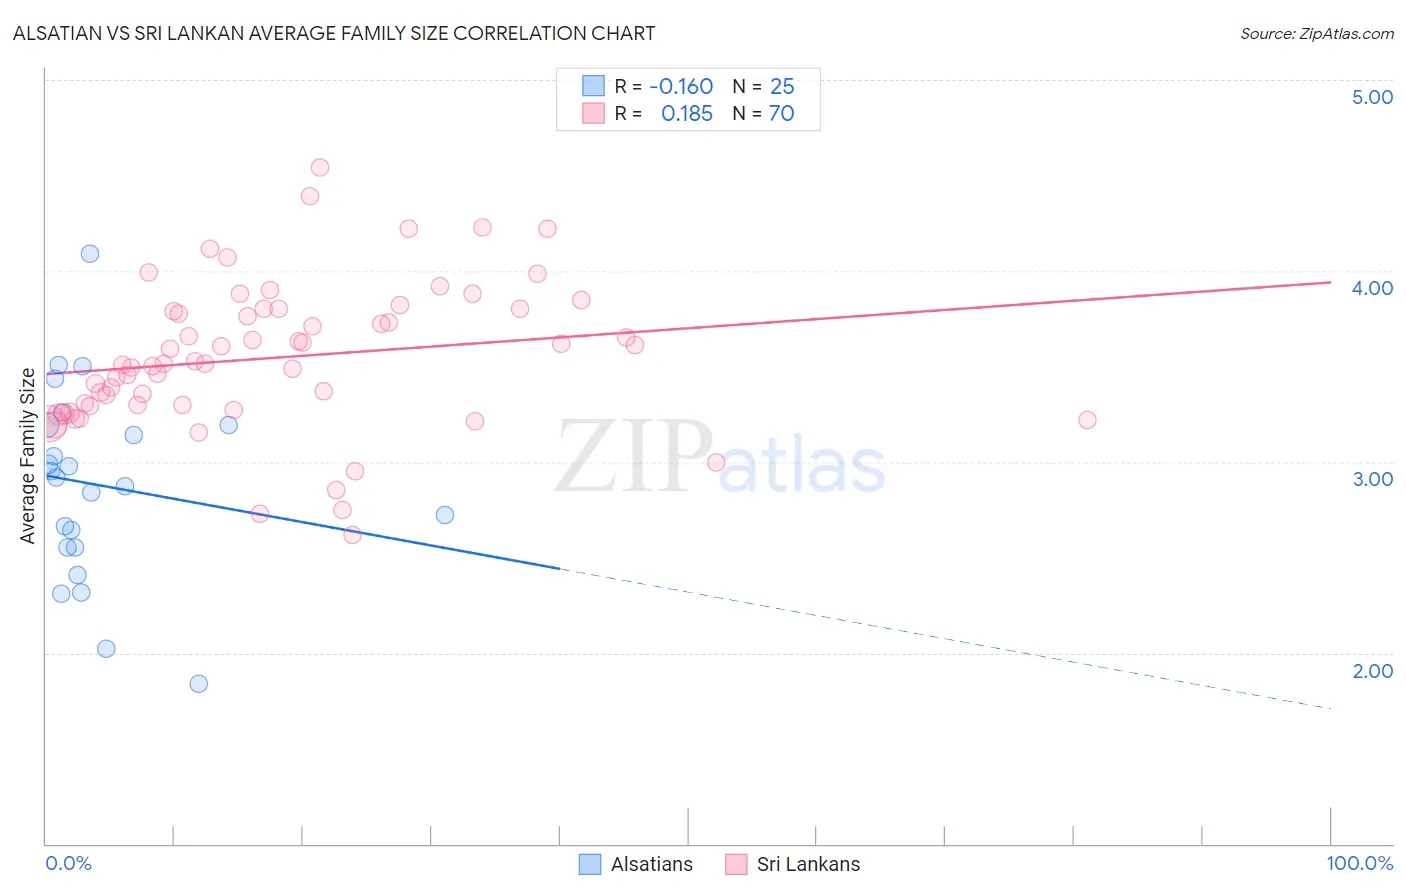
Alsatian vs Sri Lankan Average Family Size Correlation Chart
The statistical analysis conducted on geographies consisting of 82,680,020 people shows a poor negative correlation between the proportion of Alsatians and average family size in the United States with a correlation coefficient (R) of -0.160 and weighted average of 3.14. Similarly, the statistical analysis conducted on geographies consisting of 440,097,378 people shows a poor positive correlation between the proportion of Sri Lankans and average family size in the United States with a correlation coefficient (R) of 0.185 and weighted average of 3.35, a difference of 6.8%.
Average Family Size Correlation Summary
| Measurement | Alsatian | Sri Lankan |
| Minimum | 1.84 | 2.62 |
| Maximum | 4.09 | 4.54 |
| Range | 2.25 | 1.92 |
| Mean | 2.88 | 3.55 |
| Median | 2.92 | 3.51 |
| Interquartile 25% (IQ1) | 2.55 | 3.29 |
| Interquartile 75% (IQ3) | 3.19 | 3.80 |
| Interquartile Range (IQR) | 0.64 | 0.51 |
| Standard Deviation (Sample) | 0.50 | 0.38 |
| Standard Deviation (Population) | 0.49 | 0.38 |
Similar Demographics by Average Family Size
Demographics Similar to Alsatians by Average Family Size
In terms of average family size, the demographic groups most similar to Alsatians are European (3.14, a difference of 0.020%), Scandinavian (3.14, a difference of 0.030%), Cypriot (3.14, a difference of 0.040%), Immigrants from Croatia (3.14, a difference of 0.050%), and Austrian (3.14, a difference of 0.050%).
| Demographics | Rating | Rank | Average Family Size |
| Immigrants | France | 0.4 /100 | #284 | Tragic 3.15 |
| Whites/Caucasians | 0.3 /100 | #285 | Tragic 3.14 |
| Immigrants | Netherlands | 0.3 /100 | #286 | Tragic 3.14 |
| Greeks | 0.3 /100 | #287 | Tragic 3.14 |
| Immigrants | Czechoslovakia | 0.3 /100 | #288 | Tragic 3.14 |
| Immigrants | Norway | 0.3 /100 | #289 | Tragic 3.14 |
| Cypriots | 0.3 /100 | #290 | Tragic 3.14 |
| Alsatians | 0.2 /100 | #291 | Tragic 3.14 |
| Europeans | 0.2 /100 | #292 | Tragic 3.14 |
| Scandinavians | 0.2 /100 | #293 | Tragic 3.14 |
| Immigrants | Croatia | 0.2 /100 | #294 | Tragic 3.14 |
| Austrians | 0.2 /100 | #295 | Tragic 3.14 |
| Ukrainians | 0.2 /100 | #296 | Tragic 3.14 |
| Immigrants | Western Europe | 0.2 /100 | #297 | Tragic 3.14 |
| Colville | 0.2 /100 | #298 | Tragic 3.14 |
Demographics Similar to Sri Lankans by Average Family Size
In terms of average family size, the demographic groups most similar to Sri Lankans are Honduran (3.35, a difference of 0.010%), Immigrants from Dominican Republic (3.35, a difference of 0.060%), Japanese (3.35, a difference of 0.10%), Immigrants from Honduras (3.36, a difference of 0.12%), and Immigrants from Armenia (3.35, a difference of 0.12%).
| Demographics | Rating | Rank | Average Family Size |
| Immigrants | Bangladesh | 100.0 /100 | #50 | Exceptional 3.36 |
| Nicaraguans | 100.0 /100 | #51 | Exceptional 3.36 |
| Fijians | 100.0 /100 | #52 | Exceptional 3.36 |
| Koreans | 100.0 /100 | #53 | Exceptional 3.36 |
| Immigrants | South Eastern Asia | 100.0 /100 | #54 | Exceptional 3.36 |
| Immigrants | Honduras | 100.0 /100 | #55 | Exceptional 3.36 |
| Immigrants | Dominican Republic | 100.0 /100 | #56 | Exceptional 3.35 |
| Sri Lankans | 100.0 /100 | #57 | Exceptional 3.35 |
| Hondurans | 100.0 /100 | #58 | Exceptional 3.35 |
| Japanese | 100.0 /100 | #59 | Exceptional 3.35 |
| Immigrants | Armenia | 100.0 /100 | #60 | Exceptional 3.35 |
| Central American Indians | 100.0 /100 | #61 | Exceptional 3.35 |
| Immigrants | Grenada | 100.0 /100 | #62 | Exceptional 3.34 |
| Chinese | 100.0 /100 | #63 | Exceptional 3.34 |
| Dominicans | 99.9 /100 | #64 | Exceptional 3.34 |