Aleut vs Immigrants from South Africa Single Mother Households

COMPARE

Aleut
Race
Ancestry
AfghanAfricanAlaska NativeAlaskan AthabascanAlbanianAleutAlsatianAmericanApacheArabArapahoArgentineanArmenianAssyrian/Chaldean/SyriacAustralianAustrianBahamianBangladeshiBarbadianBasqueBelgianBelizeanBermudanBhutaneseBlackfeetBolivianBrazilianBritishBritish West IndianBulgarianBurmeseCajunCambodianCanadianCape VerdeanCarpatho RusynCelticCentral AmericanCentral American IndianCherokeeCheyenneChickasawChileanChineseChippewaChoctawColombianColvilleComancheCosta RicanCreeCreekCroatianCrowCubanCypriotCzechCzechoslovakianDanishDelawareDominicanDutchDutch West IndianEastern EuropeanEcuadorianEgyptianEnglishEstonianEthiopianEuropeanFijianFilipinoFinnishFrenchFrench American IndianFrench CanadianGermanGerman RussianGhanaianGreekGuamanian/ChamorroGuatemalanGuyaneseHaitianHmongHonduranHopiHoumaHungarianIcelanderIndian (Asian)IndonesianInupiatIranianIraqiIrishIroquoisIsraeliItalianJamaicanJapaneseJordanianKenyanKiowaKoreanLaotianLatvianLebaneseLiberianLithuanianLumbeeLuxembourgerMacedonianMalaysianMalteseMarshalleseMenomineeMexicanMexican American IndianMongolianMoroccanNative HawaiianNavajoNepaleseNew ZealanderNicaraguanNigerianNorthern EuropeanNorwegianOkinawanOsageOttawaPaiutePakistaniPalestinianPanamanianParaguayanPennsylvania GermanPeruvianPimaPolishPortuguesePotawatomiPuebloPuerto RicanPuget Sound SalishRomanianRussianSalvadoranSamoanScandinavianScotch-IrishScottishSeminoleSenegaleseSerbianShoshoneSierra LeoneanSiouxSlavicSlovakSloveneSomaliSouth AfricanSouth AmericanSouth American IndianSoviet UnionSpaniardSpanishSpanish AmericanSpanish American IndianSri LankanSubsaharan AfricanSudaneseSwedishSwissSyrianTaiwaneseThaiTlingit-HaidaTohono O'OdhamTonganTrinidadian and TobagonianTsimshianTurkishU.S. Virgin IslanderUgandanUkrainianUruguayanUteVenezuelanVietnameseWelshWest IndianYakamaYaquiYugoslavianYumanYup'ikZimbabwean
Immigration
NonimmigrantsImmigrantsAfghanistanAfricaAlbaniaArgentinaArmeniaAsiaAustraliaAustriaBahamasBangladeshBarbadosBelarusBelgiumBelizeBoliviaBosnia and HerzegovinaBrazilBulgariaBurma/MyanmarCabo VerdeCambodiaCameroonCanadaCaribbeanCentral AmericaChileChinaColombiaCongoCosta RicaCroatiaCubaCzechoslovakiaDenmarkDominicaDominican RepublicEastern AfricaEastern AsiaEastern EuropeEcuadorEgyptEl SalvadorEnglandEritreaEthiopiaEuropeFijiFranceGermanyGhanaGreeceGrenadaGuatemalaGuyanaHaitiHondurasHong KongHungaryIndiaIndonesiaIranIraqIrelandIsraelItalyJamaicaJapanJordanKazakhstanKenyaKoreaKuwaitLaosLatin AmericaLatviaLebanonLiberiaLithuaniaMalaysiaMexicoMicronesiaMiddle AfricaMoldovaMoroccoNepalNetherlandsNicaraguaNigeriaNorth AmericaNorth MacedoniaNorthern AfricaNorthern EuropeNorwayOceaniaPakistanPanamaPeruPhilippinesPolandPortugalRomaniaRussiaSaudi ArabiaScotlandSenegalSerbiaSierra LeoneSingaporeSomaliaSouth AmericaSouth Central AsiaSouth Eastern AsiaSouthern EuropeSpainSri LankaSt. Vincent and the GrenadinesSudanSwedenSwitzerlandSyriaTaiwanThailandTrinidad and TobagoTurkeyUgandaUkraineUruguayUzbekistanVenezuelaVietnamWest IndiesWestern AfricaWestern AsiaWestern EuropeYemenZaireZimbabweAzores
Immigrants from South Africa
Race
Ancestry
AfghanAfricanAlaska NativeAlaskan AthabascanAlbanianAlsatianAmericanApacheArabArapahoArgentineanArmenianAssyrian/Chaldean/SyriacAustralianAustrianBahamianBangladeshiBarbadianBasqueBelgianBelizeanBermudanBhutaneseBlackfeetBolivianBrazilianBritishBritish West IndianBulgarianBurmeseCajunCambodianCanadianCape VerdeanCarpatho RusynCelticCentral AmericanCentral American IndianCherokeeCheyenneChickasawChileanChineseChippewaChoctawColombianColvilleComancheCosta RicanCreeCreekCroatianCrowCubanCypriotCzechCzechoslovakianDanishDelawareDominicanDutchDutch West IndianEastern EuropeanEcuadorianEgyptianEnglishEstonianEthiopianEuropeanFijianFilipinoFinnishFrenchFrench American IndianFrench CanadianGermanGerman RussianGhanaianGreekGuamanian/ChamorroGuatemalanGuyaneseHaitianHmongHonduranHopiHoumaHungarianIcelanderIndian (Asian)IndonesianInupiatIranianIraqiIrishIroquoisIsraeliItalianJamaicanJapaneseJordanianKenyanKiowaKoreanLaotianLatvianLebaneseLiberianLithuanianLumbeeLuxembourgerMacedonianMalaysianMalteseMarshalleseMenomineeMexicanMexican American IndianMongolianMoroccanNative HawaiianNavajoNepaleseNew ZealanderNicaraguanNigerianNorthern EuropeanNorwegianOkinawanOsageOttawaPaiutePakistaniPalestinianPanamanianParaguayanPennsylvania GermanPeruvianPimaPolishPortuguesePotawatomiPuebloPuerto RicanPuget Sound SalishRomanianRussianSalvadoranSamoanScandinavianScotch-IrishScottishSeminoleSenegaleseSerbianShoshoneSierra LeoneanSiouxSlavicSlovakSloveneSomaliSouth AfricanSouth AmericanSouth American IndianSoviet UnionSpaniardSpanishSpanish AmericanSpanish American IndianSri LankanSubsaharan AfricanSudaneseSwedishSwissSyrianTaiwaneseThaiTlingit-HaidaTohono O'OdhamTonganTrinidadian and TobagonianTsimshianTurkishU.S. Virgin IslanderUgandanUkrainianUruguayanUteVenezuelanVietnameseWelshWest IndianYakamaYaquiYugoslavianYumanYup'ikZimbabwean
Immigration
NonimmigrantsImmigrantsAfghanistanAfricaAlbaniaArgentinaArmeniaAsiaAustraliaAustriaBahamasBangladeshBarbadosBelarusBelgiumBelizeBoliviaBosnia and HerzegovinaBrazilBulgariaBurma/MyanmarCabo VerdeCambodiaCameroonCanadaCaribbeanCentral AmericaChileChinaColombiaCongoCosta RicaCroatiaCubaCzechoslovakiaDenmarkDominicaDominican RepublicEastern AfricaEastern AsiaEastern EuropeEcuadorEgyptEl SalvadorEnglandEritreaEthiopiaEuropeFijiFranceGermanyGhanaGreeceGrenadaGuatemalaGuyanaHaitiHondurasHong KongHungaryIndiaIndonesiaIranIraqIrelandIsraelItalyJamaicaJapanJordanKazakhstanKenyaKoreaKuwaitLaosLatin AmericaLatviaLebanonLiberiaLithuaniaMalaysiaMexicoMicronesiaMiddle AfricaMoldovaMoroccoNepalNetherlandsNicaraguaNigeriaNorth AmericaNorth MacedoniaNorthern AfricaNorthern EuropeNorwayOceaniaPakistanPanamaPeruPhilippinesPolandPortugalRomaniaRussiaSaudi ArabiaScotlandSenegalSerbiaSierra LeoneSingaporeSomaliaSouth AfricaSouth AmericaSouth Central AsiaSouth Eastern AsiaSouthern EuropeSpainSri LankaSt. Vincent and the GrenadinesSudanSwedenSwitzerlandSyriaTaiwanThailandTrinidad and TobagoTurkeyUgandaUkraineUruguayUzbekistanVenezuelaVietnamWest IndiesWestern AfricaWestern AsiaWestern EuropeYemenZaireZimbabweAzores
Single Mother Households
Income
Poverty
Unemployment
Labor Participation
Family Structure
Vehicle Availability
Education Level
Disability

Single Mother Households Comparison

Aleuts

Immigrants from South Africa

Tragic
Exceptional
6.8%
SINGLE MOTHER HOUSEHOLDS
4.8/ 100
METRIC RATING
217th/ 347
METRIC RANK
5.7%
SINGLE MOTHER HOUSEHOLDS
96.3/ 100
METRIC RATING
98th/ 347
METRIC RANK

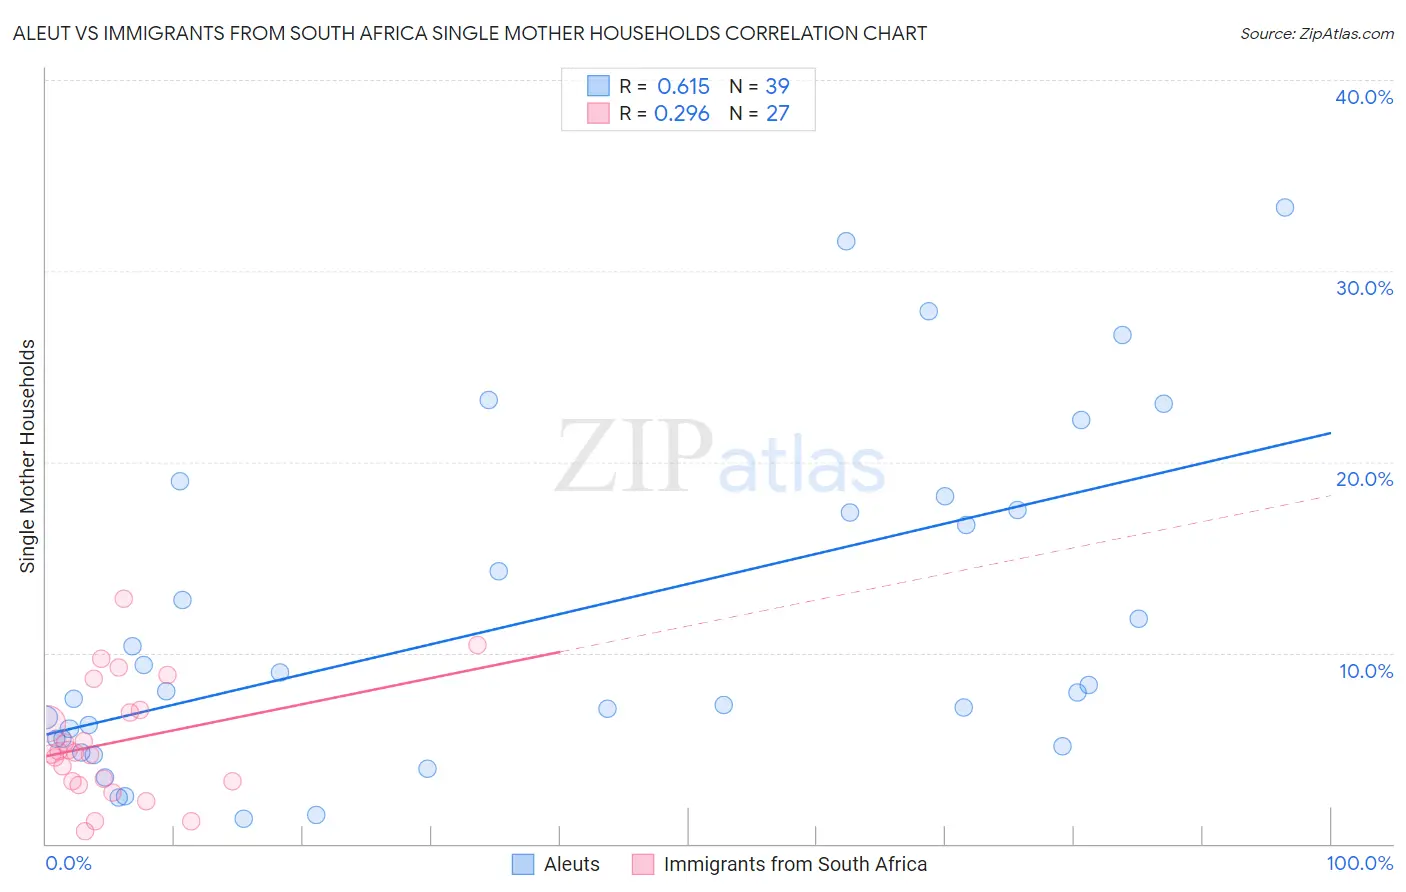
Aleut vs Immigrants from South Africa Single Mother Households Correlation Chart

The statistical analysis conducted on geographies consisting of 61,699,549 people shows a significant positive correlation between the proportion of Aleuts and percentage of single mother households in the United States with a correlation coefficient (R) of 0.615 and weighted average of 6.8%. Similarly, the statistical analysis conducted on geographies consisting of 232,880,827 people shows a weak positive correlation between the proportion of Immigrants from South Africa and percentage of single mother households in the United States with a correlation coefficient (R) of 0.296 and weighted average of 5.7%, a difference of 18.8%.
Aleut vs Immigrants from South Africa Single Mother Households

Single Mother Households Correlation Summary

MeasurementAleutImmigrants from South Africa
Minimum1.3%0.63%
Maximum33.3%12.8%
Range32.0%12.2%
Mean11.7%5.3%
Median8.0%4.8%
Interquartile 25% (IQ1)5.5%3.3%
Interquartile 75% (IQ3)17.5%7.0%
Interquartile Range (IQR)12.0%3.8%
Standard Deviation (Sample)8.7%3.0%
Standard Deviation (Population)8.6%3.0%

Similar Demographics by Single Mother Households

Demographics Similar to Aleuts by Single Mother Households

In terms of single mother households, the demographic groups most similar to Aleuts are Cherokee (6.8%, a difference of 0.14%), Immigrants from Eastern Africa (6.8%, a difference of 0.21%), Immigrants (6.8%, a difference of 0.30%), Shoshone (6.8%, a difference of 0.44%), and Immigrants from Thailand (6.9%, a difference of 0.49%).
DemographicsRating | RankSingle Mother Households
Immigrants | Nonimmigrants
10.4
/100
|
#210
Poor
6.7%
Immigrants | Venezuela
8.5
/100
|
#211
Tragic
6.7%
Immigrants | Eritrea
8.4
/100
|
#212
Tragic
6.7%
Immigrants | Costa Rica
8.2
/100
|
#213
Tragic
6.7%
Immigrants | Uruguay
7.9
/100
|
#214
Tragic
6.7%
Shoshone
5.7
/100
|
#215
Tragic
6.8%
Cherokee
5.1
/100
|
#216
Tragic
6.8%
Aleuts
4.8
/100
|
#217
Tragic
6.8%
Immigrants | Eastern Africa
4.4
/100
|
#218
Tragic
6.8%
Immigrants | Immigrants
4.3
/100
|
#219
Tragic
6.8%
Immigrants | Thailand
4.0
/100
|
#220
Tragic
6.9%
French American Indians
3.7
/100
|
#221
Tragic
6.9%
Immigrants | Bangladesh
3.7
/100
|
#222
Tragic
6.9%
Immigrants | Micronesia
3.6
/100
|
#223
Tragic
6.9%
Immigrants | Sudan
3.5
/100
|
#224
Tragic
6.9%

Demographics Similar to Immigrants from South Africa by Single Mother Households

In terms of single mother households, the demographic groups most similar to Immigrants from South Africa are Tlingit-Haida (5.7%, a difference of 0.040%), Immigrants from Poland (5.8%, a difference of 0.050%), Scandinavian (5.8%, a difference of 0.070%), Austrian (5.7%, a difference of 0.090%), and German (5.8%, a difference of 0.10%).
DemographicsRating | RankSingle Mother Households
Europeans
97.0
/100
|
#91
Exceptional
5.7%
Immigrants | Western Asia
96.7
/100
|
#92
Exceptional
5.7%
Serbians
96.7
/100
|
#93
Exceptional
5.7%
Basques
96.7
/100
|
#94
Exceptional
5.7%
Slovaks
96.6
/100
|
#95
Exceptional
5.7%
Austrians
96.4
/100
|
#96
Exceptional
5.7%
Tlingit-Haida
96.4
/100
|
#97
Exceptional
5.7%
Immigrants | South Africa
96.3
/100
|
#98
Exceptional
5.7%
Immigrants | Poland
96.3
/100
|
#99
Exceptional
5.8%
Scandinavians
96.2
/100
|
#100
Exceptional
5.8%
Germans
96.2
/100
|
#101
Exceptional
5.8%
English
96.2
/100
|
#102
Exceptional
5.8%
Scottish
96.2
/100
|
#103
Exceptional
5.8%
Northern Europeans
96.2
/100
|
#104
Exceptional
5.8%
Taiwanese
96.1
/100
|
#105
Exceptional
5.8%