Aleut vs Irish Single Mother Households
COMPARE
Aleut
Irish
Single Mother Households
Single Mother Households Comparison
Aleuts
Irish
6.8%
SINGLE MOTHER HOUSEHOLDS
4.8/ 100
METRIC RATING
217th/ 347
METRIC RANK
5.8%
SINGLE MOTHER HOUSEHOLDS
94.8/ 100
METRIC RATING
115th/ 347
METRIC RANK
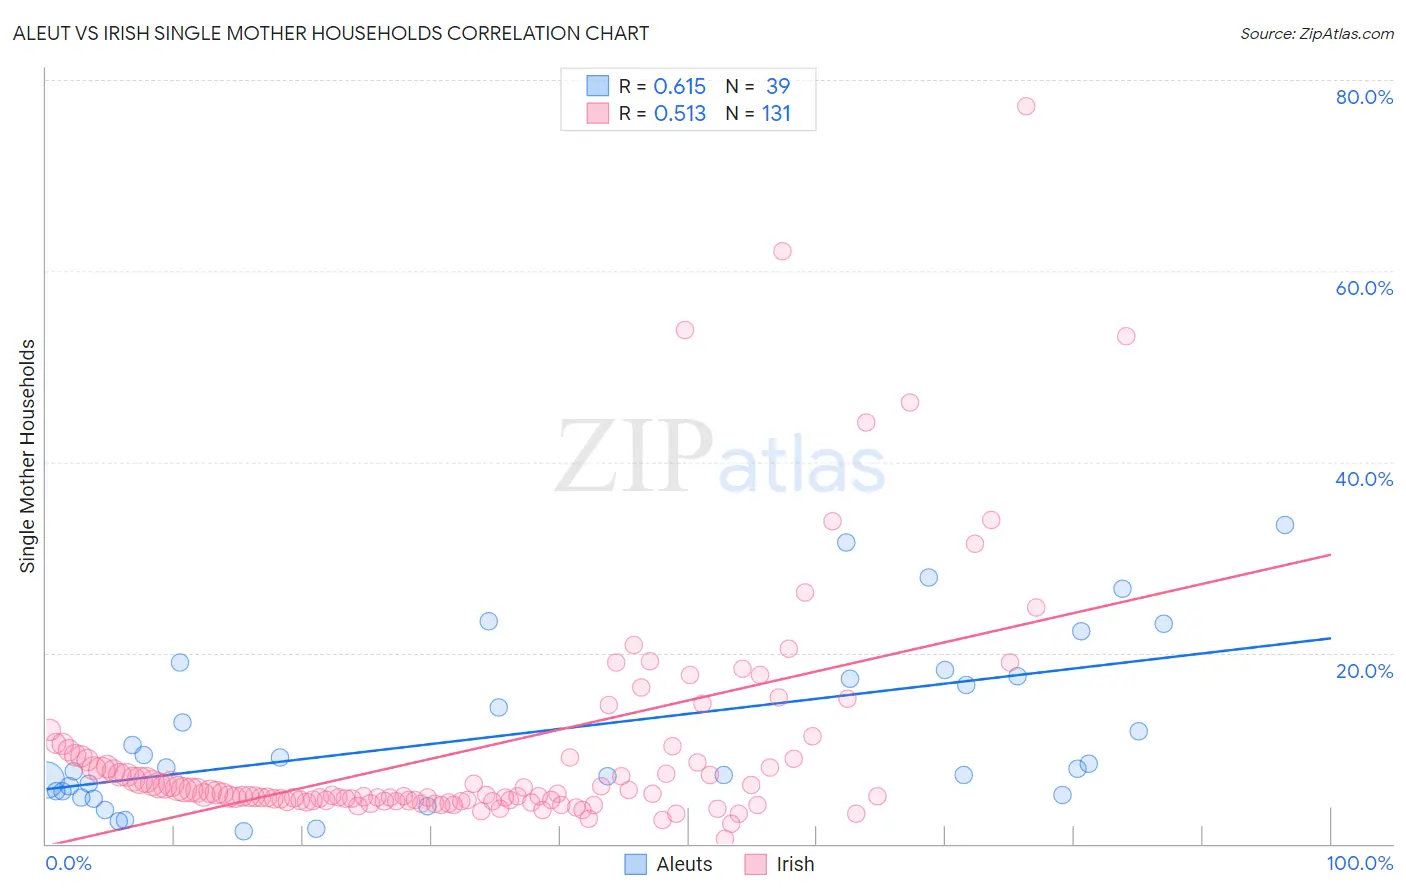
Aleut vs Irish Single Mother Households Correlation Chart
The statistical analysis conducted on geographies consisting of 61,699,549 people shows a significant positive correlation between the proportion of Aleuts and percentage of single mother households in the United States with a correlation coefficient (R) of 0.615 and weighted average of 6.8%. Similarly, the statistical analysis conducted on geographies consisting of 573,559,537 people shows a substantial positive correlation between the proportion of Irish and percentage of single mother households in the United States with a correlation coefficient (R) of 0.513 and weighted average of 5.8%, a difference of 17.5%.
Single Mother Households Correlation Summary
| Measurement | Aleut | Irish |
| Minimum | 1.3% | 0.49% |
| Maximum | 33.3% | 77.3% |
| Range | 32.0% | 76.8% |
| Mean | 11.7% | 10.0% |
| Median | 8.0% | 5.2% |
| Interquartile 25% (IQ1) | 5.5% | 4.5% |
| Interquartile 75% (IQ3) | 17.5% | 9.0% |
| Interquartile Range (IQR) | 12.0% | 4.5% |
| Standard Deviation (Sample) | 8.7% | 12.1% |
| Standard Deviation (Population) | 8.6% | 12.0% |
Similar Demographics by Single Mother Households
Demographics Similar to Aleuts by Single Mother Households
In terms of single mother households, the demographic groups most similar to Aleuts are Cherokee (6.8%, a difference of 0.14%), Immigrants from Eastern Africa (6.8%, a difference of 0.21%), Immigrants (6.8%, a difference of 0.30%), Shoshone (6.8%, a difference of 0.44%), and Immigrants from Thailand (6.9%, a difference of 0.49%).
| Demographics | Rating | Rank | Single Mother Households |
| Immigrants | Nonimmigrants | 10.4 /100 | #210 | Poor 6.7% |
| Immigrants | Venezuela | 8.5 /100 | #211 | Tragic 6.7% |
| Immigrants | Eritrea | 8.4 /100 | #212 | Tragic 6.7% |
| Immigrants | Costa Rica | 8.2 /100 | #213 | Tragic 6.7% |
| Immigrants | Uruguay | 7.9 /100 | #214 | Tragic 6.7% |
| Shoshone | 5.7 /100 | #215 | Tragic 6.8% |
| Cherokee | 5.1 /100 | #216 | Tragic 6.8% |
| Aleuts | 4.8 /100 | #217 | Tragic 6.8% |
| Immigrants | Eastern Africa | 4.4 /100 | #218 | Tragic 6.8% |
| Immigrants | Immigrants | 4.3 /100 | #219 | Tragic 6.8% |
| Immigrants | Thailand | 4.0 /100 | #220 | Tragic 6.9% |
| French American Indians | 3.7 /100 | #221 | Tragic 6.9% |
| Immigrants | Bangladesh | 3.7 /100 | #222 | Tragic 6.9% |
| Immigrants | Micronesia | 3.6 /100 | #223 | Tragic 6.9% |
| Immigrants | Sudan | 3.5 /100 | #224 | Tragic 6.9% |
Demographics Similar to Irish by Single Mother Households
In terms of single mother households, the demographic groups most similar to Irish are Pennsylvania German (5.8%, a difference of 0.070%), Bolivian (5.8%, a difference of 0.14%), Dutch (5.8%, a difference of 0.19%), Mongolian (5.8%, a difference of 0.31%), and Laotian (5.8%, a difference of 0.32%).
| Demographics | Rating | Rank | Single Mother Households |
| Immigrants | Italy | 95.8 /100 | #108 | Exceptional 5.8% |
| Immigrants | Western Europe | 95.7 /100 | #109 | Exceptional 5.8% |
| British | 95.5 /100 | #110 | Exceptional 5.8% |
| Immigrants | England | 95.5 /100 | #111 | Exceptional 5.8% |
| Immigrants | Kuwait | 95.4 /100 | #112 | Exceptional 5.8% |
| Mongolians | 95.3 /100 | #113 | Exceptional 5.8% |
| Dutch | 95.1 /100 | #114 | Exceptional 5.8% |
| Irish | 94.8 /100 | #115 | Exceptional 5.8% |
| Pennsylvania Germans | 94.7 /100 | #116 | Exceptional 5.8% |
| Bolivians | 94.6 /100 | #117 | Exceptional 5.8% |
| Laotians | 94.3 /100 | #118 | Exceptional 5.8% |
| South Africans | 94.1 /100 | #119 | Exceptional 5.8% |
| Tongans | 93.7 /100 | #120 | Exceptional 5.8% |
| Argentineans | 93.7 /100 | #121 | Exceptional 5.8% |
| Belgians | 93.5 /100 | #122 | Exceptional 5.8% |