Osage vs Afghan Single Mother Households
COMPARE
Osage
Afghan
Single Mother Households
Single Mother Households Comparison
Osage
Afghans
6.4%
SINGLE MOTHER HOUSEHOLDS
43.0/ 100
METRIC RATING
177th/ 347
METRIC RANK
6.3%
SINGLE MOTHER HOUSEHOLDS
52.5/ 100
METRIC RATING
171st/ 347
METRIC RANK
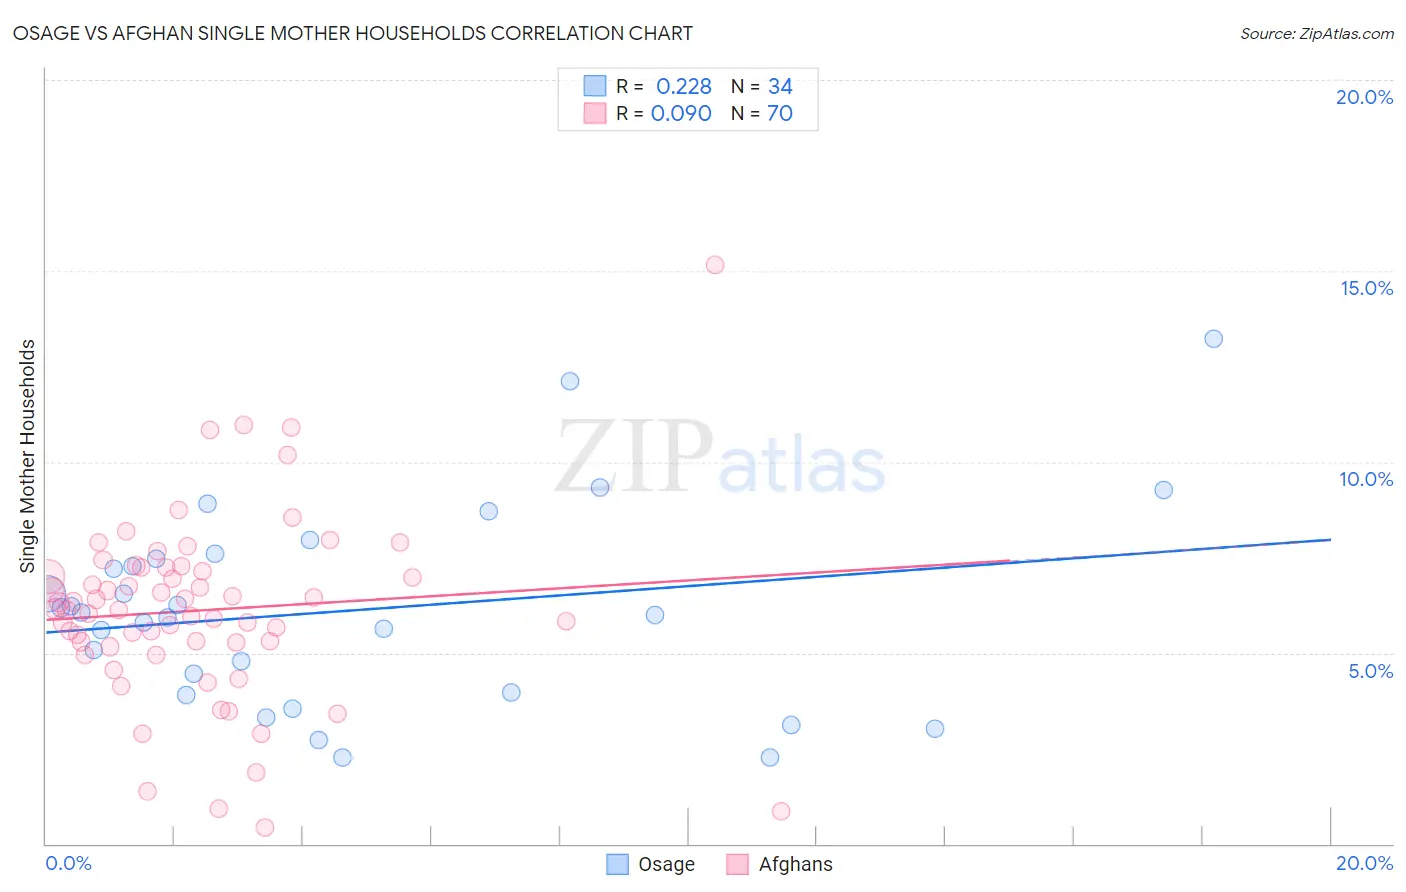
Osage vs Afghan Single Mother Households Correlation Chart
The statistical analysis conducted on geographies consisting of 91,762,553 people shows a weak positive correlation between the proportion of Osage and percentage of single mother households in the United States with a correlation coefficient (R) of 0.228 and weighted average of 6.4%. Similarly, the statistical analysis conducted on geographies consisting of 148,722,502 people shows a slight positive correlation between the proportion of Afghans and percentage of single mother households in the United States with a correlation coefficient (R) of 0.090 and weighted average of 6.3%, a difference of 1.1%.
Single Mother Households Correlation Summary
| Measurement | Osage | Afghan |
| Minimum | 2.2% | 0.41% |
| Maximum | 13.2% | 15.1% |
| Range | 11.0% | 14.7% |
| Mean | 6.1% | 6.1% |
| Median | 6.0% | 6.1% |
| Interquartile 25% (IQ1) | 4.0% | 5.3% |
| Interquartile 75% (IQ3) | 7.5% | 7.2% |
| Interquartile Range (IQR) | 3.5% | 2.0% |
| Standard Deviation (Sample) | 2.6% | 2.4% |
| Standard Deviation (Population) | 2.6% | 2.4% |
Demographics Similar to Osage and Afghans by Single Mother Households
In terms of single mother households, the demographic groups most similar to Osage are Immigrants from Bosnia and Herzegovina (6.3%, a difference of 0.14%), Marshallese (6.3%, a difference of 0.30%), Portuguese (6.4%, a difference of 0.34%), Hmong (6.4%, a difference of 0.36%), and Immigrants from Morocco (6.3%, a difference of 0.77%). Similarly, the demographic groups most similar to Afghans are Immigrants from South Eastern Asia (6.3%, a difference of 0.040%), Immigrants from Vietnam (6.3%, a difference of 0.11%), Immigrants from Oceania (6.3%, a difference of 0.23%), Immigrants from Morocco (6.3%, a difference of 0.28%), and Puget Sound Salish (6.3%, a difference of 0.63%).
| Demographics | Rating | Rank | Single Mother Households |
| Immigrants | Northern Africa | 68.0 /100 | #164 | Good 6.2% |
| Immigrants | Syria | 67.4 /100 | #165 | Good 6.2% |
| Sri Lankans | 63.9 /100 | #166 | Good 6.2% |
| Brazilians | 59.1 /100 | #167 | Average 6.2% |
| Immigrants | Chile | 58.3 /100 | #168 | Average 6.3% |
| Puget Sound Salish | 58.1 /100 | #169 | Average 6.3% |
| Immigrants | Oceania | 54.6 /100 | #170 | Average 6.3% |
| Afghans | 52.5 /100 | #171 | Average 6.3% |
| Immigrants | South Eastern Asia | 52.2 /100 | #172 | Average 6.3% |
| Immigrants | Vietnam | 51.5 /100 | #173 | Average 6.3% |
| Immigrants | Morocco | 50.0 /100 | #174 | Average 6.3% |
| Marshallese | 45.8 /100 | #175 | Average 6.3% |
| Immigrants | Bosnia and Herzegovina | 44.3 /100 | #176 | Average 6.3% |
| Osage | 43.0 /100 | #177 | Average 6.4% |
| Portuguese | 40.0 /100 | #178 | Fair 6.4% |
| Hmong | 39.8 /100 | #179 | Fair 6.4% |
| Immigrants | Nepal | 36.1 /100 | #180 | Fair 6.4% |
| Spanish | 33.4 /100 | #181 | Fair 6.4% |
| South American Indians | 33.4 /100 | #182 | Fair 6.4% |
| Spaniards | 27.8 /100 | #183 | Fair 6.5% |
| Ethiopians | 26.0 /100 | #184 | Fair 6.5% |