Aleut vs Immigrants from Denmark Single Mother Households
COMPARE
Aleut
Immigrants from Denmark
Single Mother Households
Single Mother Households Comparison
Aleuts
Immigrants from Denmark
6.8%
SINGLE MOTHER HOUSEHOLDS
4.8/ 100
METRIC RATING
217th/ 347
METRIC RANK
5.5%
SINGLE MOTHER HOUSEHOLDS
99.1/ 100
METRIC RATING
55th/ 347
METRIC RANK
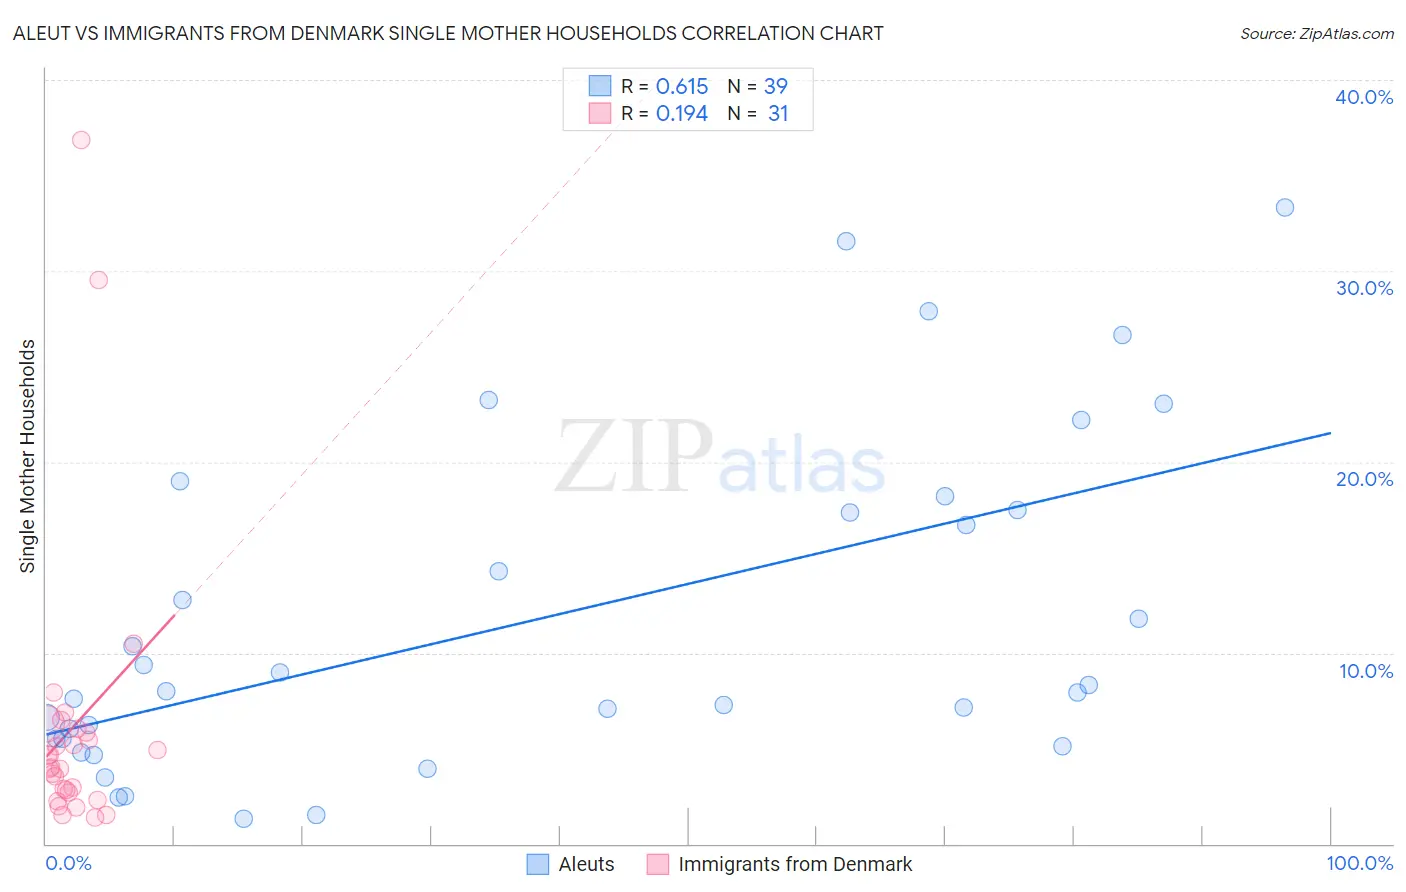
Aleut vs Immigrants from Denmark Single Mother Households Correlation Chart
The statistical analysis conducted on geographies consisting of 61,699,549 people shows a significant positive correlation between the proportion of Aleuts and percentage of single mother households in the United States with a correlation coefficient (R) of 0.615 and weighted average of 6.8%. Similarly, the statistical analysis conducted on geographies consisting of 136,130,833 people shows a poor positive correlation between the proportion of Immigrants from Denmark and percentage of single mother households in the United States with a correlation coefficient (R) of 0.194 and weighted average of 5.5%, a difference of 23.9%.
Single Mother Households Correlation Summary
| Measurement | Aleut | Immigrants from Denmark |
| Minimum | 1.3% | 1.4% |
| Maximum | 33.3% | 36.9% |
| Range | 32.0% | 35.5% |
| Mean | 11.7% | 6.1% |
| Median | 8.0% | 4.0% |
| Interquartile 25% (IQ1) | 5.5% | 2.7% |
| Interquartile 75% (IQ3) | 17.5% | 6.0% |
| Interquartile Range (IQR) | 12.0% | 3.3% |
| Standard Deviation (Sample) | 8.7% | 7.6% |
| Standard Deviation (Population) | 8.6% | 7.5% |
Similar Demographics by Single Mother Households
Demographics Similar to Aleuts by Single Mother Households
In terms of single mother households, the demographic groups most similar to Aleuts are Cherokee (6.8%, a difference of 0.14%), Immigrants from Eastern Africa (6.8%, a difference of 0.21%), Immigrants (6.8%, a difference of 0.30%), Shoshone (6.8%, a difference of 0.44%), and Immigrants from Thailand (6.9%, a difference of 0.49%).
| Demographics | Rating | Rank | Single Mother Households |
| Immigrants | Nonimmigrants | 10.4 /100 | #210 | Poor 6.7% |
| Immigrants | Venezuela | 8.5 /100 | #211 | Tragic 6.7% |
| Immigrants | Eritrea | 8.4 /100 | #212 | Tragic 6.7% |
| Immigrants | Costa Rica | 8.2 /100 | #213 | Tragic 6.7% |
| Immigrants | Uruguay | 7.9 /100 | #214 | Tragic 6.7% |
| Shoshone | 5.7 /100 | #215 | Tragic 6.8% |
| Cherokee | 5.1 /100 | #216 | Tragic 6.8% |
| Aleuts | 4.8 /100 | #217 | Tragic 6.8% |
| Immigrants | Eastern Africa | 4.4 /100 | #218 | Tragic 6.8% |
| Immigrants | Immigrants | 4.3 /100 | #219 | Tragic 6.8% |
| Immigrants | Thailand | 4.0 /100 | #220 | Tragic 6.9% |
| French American Indians | 3.7 /100 | #221 | Tragic 6.9% |
| Immigrants | Bangladesh | 3.7 /100 | #222 | Tragic 6.9% |
| Immigrants | Micronesia | 3.6 /100 | #223 | Tragic 6.9% |
| Immigrants | Sudan | 3.5 /100 | #224 | Tragic 6.9% |
Demographics Similar to Immigrants from Denmark by Single Mother Households
In terms of single mother households, the demographic groups most similar to Immigrants from Denmark are Immigrants from Romania (5.5%, a difference of 0.070%), Immigrants from Europe (5.5%, a difference of 0.15%), Immigrants from Lebanon (5.5%, a difference of 0.17%), Immigrants from Russia (5.5%, a difference of 0.19%), and Swedish (5.5%, a difference of 0.29%).
| Demographics | Rating | Rank | Single Mother Households |
| Turks | 99.2 /100 | #48 | Exceptional 5.5% |
| Immigrants | Latvia | 99.2 /100 | #49 | Exceptional 5.5% |
| Immigrants | Scotland | 99.2 /100 | #50 | Exceptional 5.5% |
| Immigrants | Belarus | 99.2 /100 | #51 | Exceptional 5.5% |
| Swedes | 99.1 /100 | #52 | Exceptional 5.5% |
| Immigrants | Russia | 99.1 /100 | #53 | Exceptional 5.5% |
| Immigrants | Lebanon | 99.1 /100 | #54 | Exceptional 5.5% |
| Immigrants | Denmark | 99.1 /100 | #55 | Exceptional 5.5% |
| Immigrants | Romania | 99.0 /100 | #56 | Exceptional 5.5% |
| Immigrants | Europe | 99.0 /100 | #57 | Exceptional 5.5% |
| Danes | 98.9 /100 | #58 | Exceptional 5.5% |
| Luxembourgers | 98.7 /100 | #59 | Exceptional 5.6% |
| Immigrants | Norway | 98.7 /100 | #60 | Exceptional 5.6% |
| Australians | 98.7 /100 | #61 | Exceptional 5.6% |
| Poles | 98.6 /100 | #62 | Exceptional 5.6% |