Immigrants from Cameroon vs Afghan Single Mother Households
COMPARE
Immigrants from Cameroon
Afghan
Single Mother Households
Single Mother Households Comparison
Immigrants from Cameroon
Afghans
7.9%
SINGLE MOTHER HOUSEHOLDS
0.0/ 100
METRIC RATING
293rd/ 347
METRIC RANK
6.3%
SINGLE MOTHER HOUSEHOLDS
52.5/ 100
METRIC RATING
171st/ 347
METRIC RANK
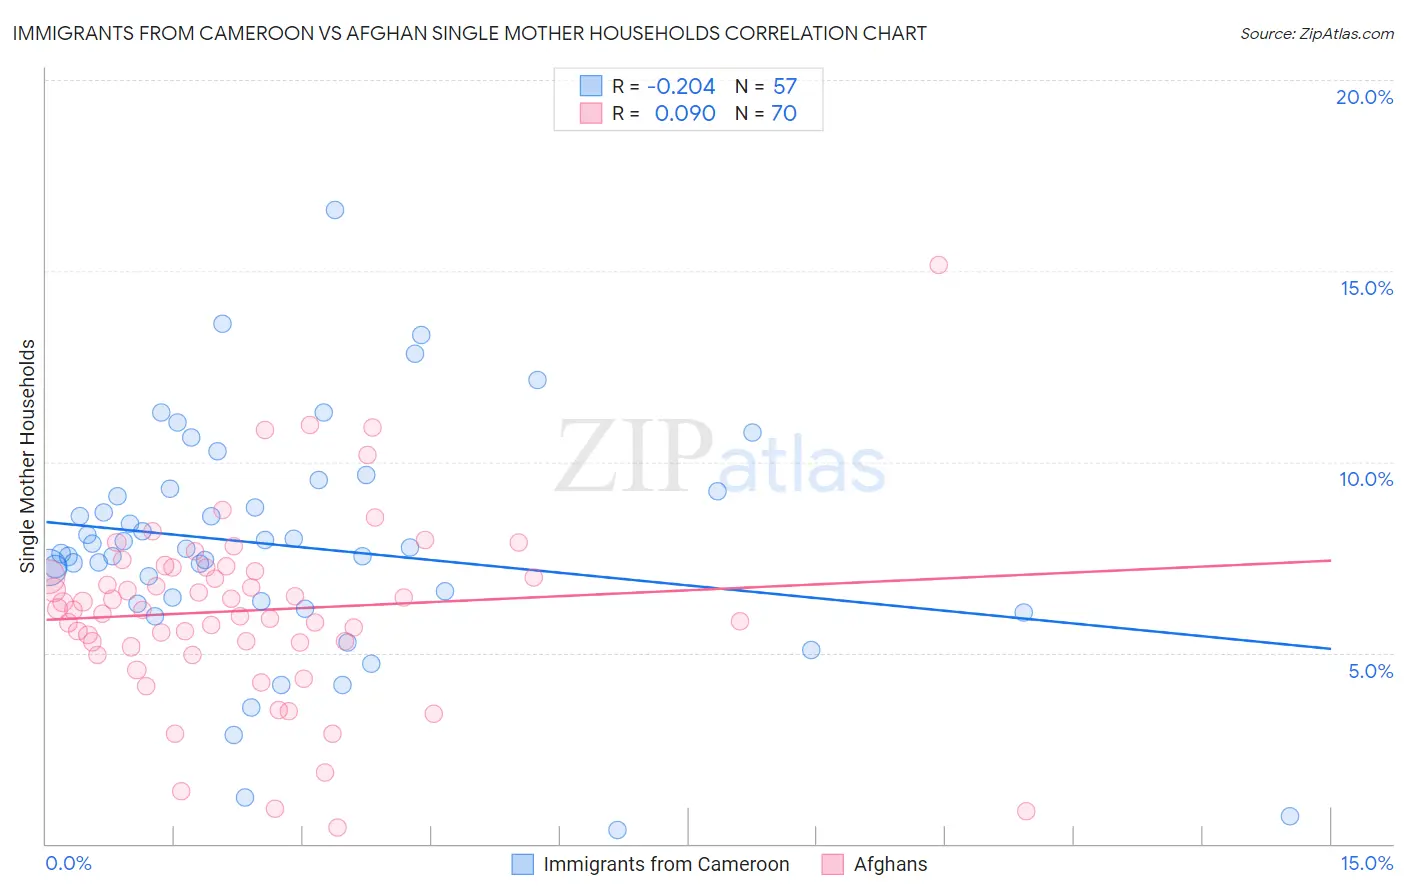
Immigrants from Cameroon vs Afghan Single Mother Households Correlation Chart
The statistical analysis conducted on geographies consisting of 130,708,507 people shows a weak negative correlation between the proportion of Immigrants from Cameroon and percentage of single mother households in the United States with a correlation coefficient (R) of -0.204 and weighted average of 7.9%. Similarly, the statistical analysis conducted on geographies consisting of 148,722,502 people shows a slight positive correlation between the proportion of Afghans and percentage of single mother households in the United States with a correlation coefficient (R) of 0.090 and weighted average of 6.3%, a difference of 25.1%.
Single Mother Households Correlation Summary
| Measurement | Immigrants from Cameroon | Afghan |
| Minimum | 0.36% | 0.41% |
| Maximum | 16.6% | 15.1% |
| Range | 16.2% | 14.7% |
| Mean | 7.8% | 6.1% |
| Median | 7.7% | 6.1% |
| Interquartile 25% (IQ1) | 6.3% | 5.3% |
| Interquartile 75% (IQ3) | 9.3% | 7.2% |
| Interquartile Range (IQR) | 2.9% | 2.0% |
| Standard Deviation (Sample) | 3.0% | 2.4% |
| Standard Deviation (Population) | 3.0% | 2.4% |
Similar Demographics by Single Mother Households
Demographics Similar to Immigrants from Cameroon by Single Mother Households
In terms of single mother households, the demographic groups most similar to Immigrants from Cameroon are Apache (7.9%, a difference of 0.10%), Ghanaian (7.8%, a difference of 0.36%), West Indian (7.8%, a difference of 0.37%), Barbadian (7.9%, a difference of 0.39%), and Immigrants from Nigeria (7.8%, a difference of 0.45%).
| Demographics | Rating | Rank | Single Mother Households |
| Immigrants | Middle Africa | 0.0 /100 | #286 | Tragic 7.7% |
| Immigrants | Guatemala | 0.0 /100 | #287 | Tragic 7.7% |
| Sierra Leoneans | 0.0 /100 | #288 | Tragic 7.7% |
| Sub-Saharan Africans | 0.0 /100 | #289 | Tragic 7.8% |
| Immigrants | Nigeria | 0.0 /100 | #290 | Tragic 7.8% |
| West Indians | 0.0 /100 | #291 | Tragic 7.8% |
| Ghanaians | 0.0 /100 | #292 | Tragic 7.8% |
| Immigrants | Cameroon | 0.0 /100 | #293 | Tragic 7.9% |
| Apache | 0.0 /100 | #294 | Tragic 7.9% |
| Barbadians | 0.0 /100 | #295 | Tragic 7.9% |
| Immigrants | Latin America | 0.0 /100 | #296 | Tragic 7.9% |
| Hispanics or Latinos | 0.0 /100 | #297 | Tragic 7.9% |
| Immigrants | West Indies | 0.0 /100 | #298 | Tragic 7.9% |
| Houma | 0.0 /100 | #299 | Tragic 7.9% |
| Mexicans | 0.0 /100 | #300 | Tragic 8.0% |
Demographics Similar to Afghans by Single Mother Households
In terms of single mother households, the demographic groups most similar to Afghans are Immigrants from South Eastern Asia (6.3%, a difference of 0.040%), Immigrants from Vietnam (6.3%, a difference of 0.11%), Immigrants from Oceania (6.3%, a difference of 0.23%), Immigrants from Morocco (6.3%, a difference of 0.28%), and Puget Sound Salish (6.3%, a difference of 0.63%).
| Demographics | Rating | Rank | Single Mother Households |
| Immigrants | Northern Africa | 68.0 /100 | #164 | Good 6.2% |
| Immigrants | Syria | 67.4 /100 | #165 | Good 6.2% |
| Sri Lankans | 63.9 /100 | #166 | Good 6.2% |
| Brazilians | 59.1 /100 | #167 | Average 6.2% |
| Immigrants | Chile | 58.3 /100 | #168 | Average 6.3% |
| Puget Sound Salish | 58.1 /100 | #169 | Average 6.3% |
| Immigrants | Oceania | 54.6 /100 | #170 | Average 6.3% |
| Afghans | 52.5 /100 | #171 | Average 6.3% |
| Immigrants | South Eastern Asia | 52.2 /100 | #172 | Average 6.3% |
| Immigrants | Vietnam | 51.5 /100 | #173 | Average 6.3% |
| Immigrants | Morocco | 50.0 /100 | #174 | Average 6.3% |
| Marshallese | 45.8 /100 | #175 | Average 6.3% |
| Immigrants | Bosnia and Herzegovina | 44.3 /100 | #176 | Average 6.3% |
| Osage | 43.0 /100 | #177 | Average 6.4% |
| Portuguese | 40.0 /100 | #178 | Fair 6.4% |