Albanian vs Immigrants from Nicaragua Family Households
COMPARE
Albanian
Immigrants from Nicaragua
Family Households
Family Households Comparison
Albanians
Immigrants from Nicaragua
63.5%
FAMILY HOUSEHOLDS
2.2/ 100
METRIC RATING
235th/ 347
METRIC RANK
67.5%
FAMILY HOUSEHOLDS
100.0/ 100
METRIC RATING
25th/ 347
METRIC RANK
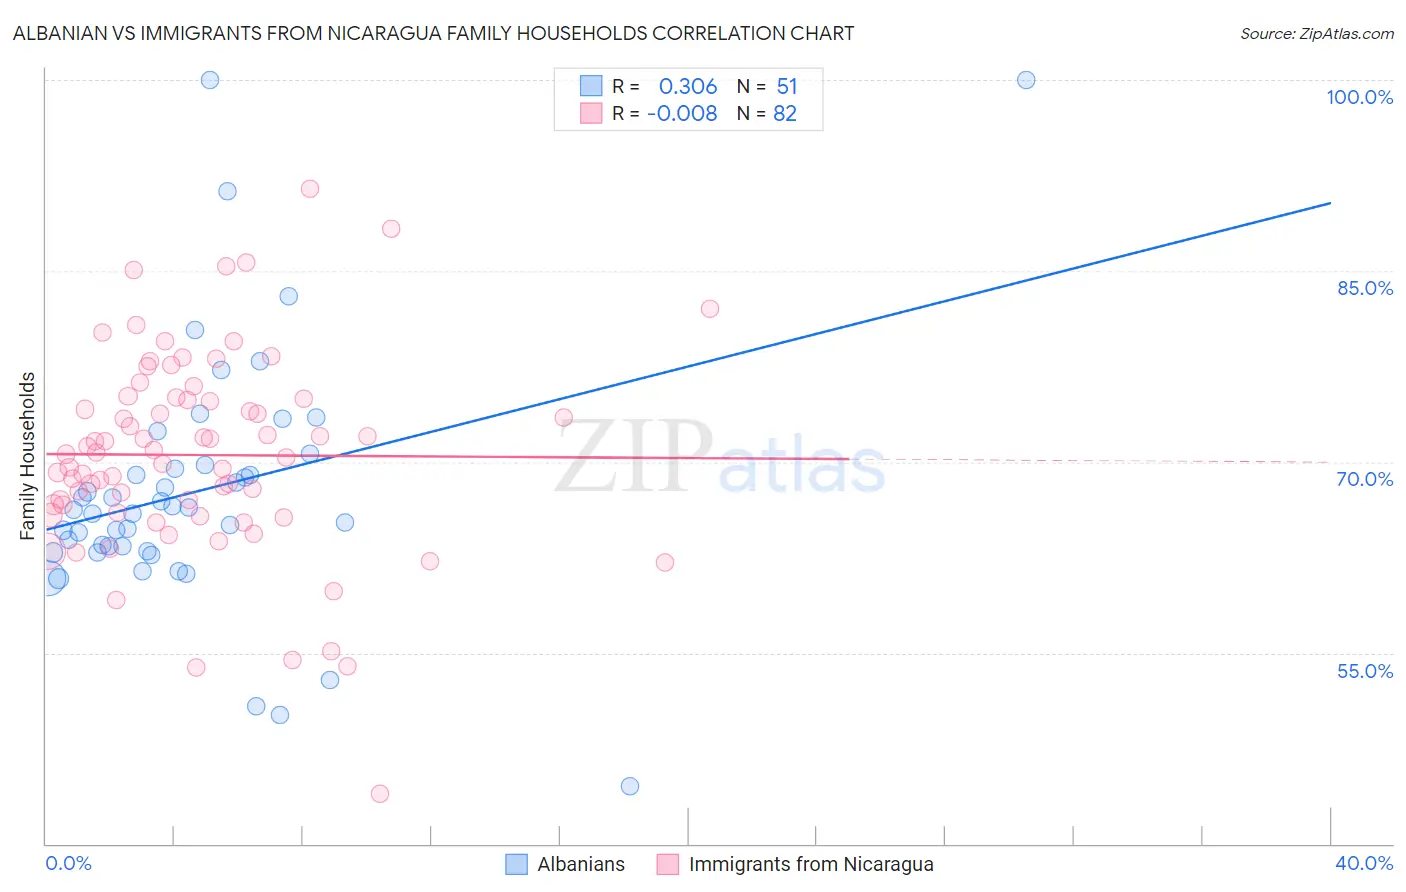
Albanian vs Immigrants from Nicaragua Family Households Correlation Chart
The statistical analysis conducted on geographies consisting of 193,187,165 people shows a mild positive correlation between the proportion of Albanians and percentage of family households in the United States with a correlation coefficient (R) of 0.306 and weighted average of 63.5%. Similarly, the statistical analysis conducted on geographies consisting of 236,325,985 people shows no correlation between the proportion of Immigrants from Nicaragua and percentage of family households in the United States with a correlation coefficient (R) of -0.008 and weighted average of 67.5%, a difference of 6.3%.
Family Households Correlation Summary
| Measurement | Albanian | Immigrants from Nicaragua |
| Minimum | 44.5% | 43.9% |
| Maximum | 100.0% | 91.5% |
| Range | 55.5% | 47.5% |
| Mean | 67.7% | 70.5% |
| Median | 66.2% | 70.7% |
| Interquartile 25% (IQ1) | 62.9% | 66.0% |
| Interquartile 75% (IQ3) | 69.7% | 75.0% |
| Interquartile Range (IQR) | 6.8% | 9.0% |
| Standard Deviation (Sample) | 10.2% | 8.0% |
| Standard Deviation (Population) | 10.1% | 7.9% |
Similar Demographics by Family Households
Demographics Similar to Albanians by Family Households
In terms of family households, the demographic groups most similar to Albanians are Ghanaian (63.5%, a difference of 0.010%), Comanche (63.5%, a difference of 0.020%), Immigrants from Zimbabwe (63.5%, a difference of 0.020%), Finnish (63.5%, a difference of 0.030%), and Immigrants from Armenia (63.5%, a difference of 0.050%).
| Demographics | Rating | Rank | Family Households |
| Blackfeet | 3.6 /100 | #228 | Tragic 63.6% |
| Bulgarians | 3.4 /100 | #229 | Tragic 63.6% |
| Immigrants | Brazil | 3.0 /100 | #230 | Tragic 63.6% |
| Immigrants | Greece | 2.9 /100 | #231 | Tragic 63.5% |
| Immigrants | Northern Africa | 2.6 /100 | #232 | Tragic 63.5% |
| Immigrants | Armenia | 2.6 /100 | #233 | Tragic 63.5% |
| Finns | 2.3 /100 | #234 | Tragic 63.5% |
| Albanians | 2.2 /100 | #235 | Tragic 63.5% |
| Ghanaians | 2.1 /100 | #236 | Tragic 63.5% |
| Comanche | 2.1 /100 | #237 | Tragic 63.5% |
| Immigrants | Zimbabwe | 2.0 /100 | #238 | Tragic 63.5% |
| Aleuts | 1.9 /100 | #239 | Tragic 63.4% |
| South Africans | 1.9 /100 | #240 | Tragic 63.4% |
| Immigrants | St. Vincent and the Grenadines | 1.9 /100 | #241 | Tragic 63.4% |
| Immigrants | Israel | 1.8 /100 | #242 | Tragic 63.4% |
Demographics Similar to Immigrants from Nicaragua by Family Households
In terms of family households, the demographic groups most similar to Immigrants from Nicaragua are Immigrants from India (67.4%, a difference of 0.010%), Immigrants from South Eastern Asia (67.5%, a difference of 0.020%), Hispanic or Latino (67.4%, a difference of 0.050%), Hawaiian (67.4%, a difference of 0.070%), and Nicaraguan (67.4%, a difference of 0.14%).
| Demographics | Rating | Rank | Family Households |
| Immigrants | Taiwan | 100.0 /100 | #18 | Exceptional 68.0% |
| Samoans | 100.0 /100 | #19 | Exceptional 67.9% |
| Inupiat | 100.0 /100 | #20 | Exceptional 67.8% |
| Cubans | 100.0 /100 | #21 | Exceptional 67.7% |
| Sri Lankans | 100.0 /100 | #22 | Exceptional 67.7% |
| Immigrants | Pakistan | 100.0 /100 | #23 | Exceptional 67.7% |
| Immigrants | South Eastern Asia | 100.0 /100 | #24 | Exceptional 67.5% |
| Immigrants | Nicaragua | 100.0 /100 | #25 | Exceptional 67.5% |
| Immigrants | India | 100.0 /100 | #26 | Exceptional 67.4% |
| Hispanics or Latinos | 100.0 /100 | #27 | Exceptional 67.4% |
| Hawaiians | 100.0 /100 | #28 | Exceptional 67.4% |
| Nicaraguans | 100.0 /100 | #29 | Exceptional 67.4% |
| Immigrants | Peru | 100.0 /100 | #30 | Exceptional 67.2% |
| Immigrants | Latin America | 100.0 /100 | #31 | Exceptional 67.2% |
| Nepalese | 100.0 /100 | #32 | Exceptional 67.2% |