Albanian vs New Zealander Family Households
COMPARE
Albanian
New Zealander
Family Households
Family Households Comparison
Albanians
New Zealanders
63.5%
FAMILY HOUSEHOLDS
2.2/ 100
METRIC RATING
235th/ 347
METRIC RANK
62.9%
FAMILY HOUSEHOLDS
0.1/ 100
METRIC RATING
282nd/ 347
METRIC RANK
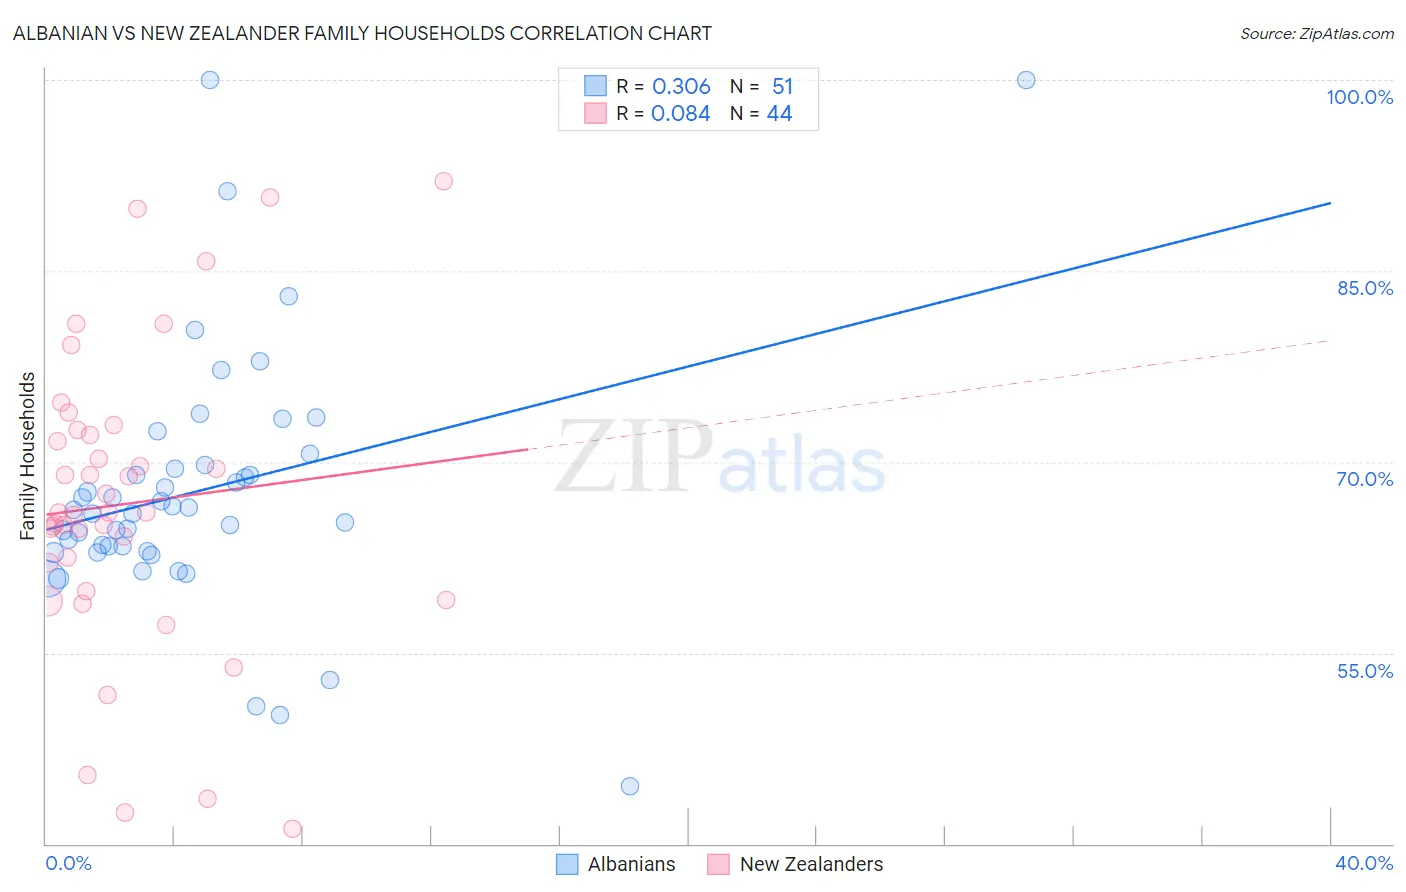
Albanian vs New Zealander Family Households Correlation Chart
The statistical analysis conducted on geographies consisting of 193,187,165 people shows a mild positive correlation between the proportion of Albanians and percentage of family households in the United States with a correlation coefficient (R) of 0.306 and weighted average of 63.5%. Similarly, the statistical analysis conducted on geographies consisting of 106,894,441 people shows a slight positive correlation between the proportion of New Zealanders and percentage of family households in the United States with a correlation coefficient (R) of 0.084 and weighted average of 62.9%, a difference of 0.95%.
Family Households Correlation Summary
| Measurement | Albanian | New Zealander |
| Minimum | 44.5% | 41.2% |
| Maximum | 100.0% | 92.0% |
| Range | 55.5% | 50.8% |
| Mean | 67.7% | 66.7% |
| Median | 66.2% | 66.0% |
| Interquartile 25% (IQ1) | 62.9% | 60.9% |
| Interquartile 75% (IQ3) | 69.7% | 72.3% |
| Interquartile Range (IQR) | 6.8% | 11.4% |
| Standard Deviation (Sample) | 10.2% | 11.8% |
| Standard Deviation (Population) | 10.1% | 11.6% |
Similar Demographics by Family Households
Demographics Similar to Albanians by Family Households
In terms of family households, the demographic groups most similar to Albanians are Ghanaian (63.5%, a difference of 0.010%), Comanche (63.5%, a difference of 0.020%), Immigrants from Zimbabwe (63.5%, a difference of 0.020%), Finnish (63.5%, a difference of 0.030%), and Immigrants from Armenia (63.5%, a difference of 0.050%).
| Demographics | Rating | Rank | Family Households |
| Blackfeet | 3.6 /100 | #228 | Tragic 63.6% |
| Bulgarians | 3.4 /100 | #229 | Tragic 63.6% |
| Immigrants | Brazil | 3.0 /100 | #230 | Tragic 63.6% |
| Immigrants | Greece | 2.9 /100 | #231 | Tragic 63.5% |
| Immigrants | Northern Africa | 2.6 /100 | #232 | Tragic 63.5% |
| Immigrants | Armenia | 2.6 /100 | #233 | Tragic 63.5% |
| Finns | 2.3 /100 | #234 | Tragic 63.5% |
| Albanians | 2.2 /100 | #235 | Tragic 63.5% |
| Ghanaians | 2.1 /100 | #236 | Tragic 63.5% |
| Comanche | 2.1 /100 | #237 | Tragic 63.5% |
| Immigrants | Zimbabwe | 2.0 /100 | #238 | Tragic 63.5% |
| Aleuts | 1.9 /100 | #239 | Tragic 63.4% |
| South Africans | 1.9 /100 | #240 | Tragic 63.4% |
| Immigrants | St. Vincent and the Grenadines | 1.9 /100 | #241 | Tragic 63.4% |
| Immigrants | Israel | 1.8 /100 | #242 | Tragic 63.4% |
Demographics Similar to New Zealanders by Family Households
In terms of family households, the demographic groups most similar to New Zealanders are Immigrants from Denmark (62.9%, a difference of 0.010%), Estonian (62.9%, a difference of 0.030%), Australian (62.8%, a difference of 0.050%), Immigrants from Bulgaria (63.0%, a difference of 0.13%), and Immigrants from Yemen (63.0%, a difference of 0.14%).
| Demographics | Rating | Rank | Family Households |
| West Indians | 0.3 /100 | #275 | Tragic 63.1% |
| Serbians | 0.3 /100 | #276 | Tragic 63.0% |
| Ottawa | 0.3 /100 | #277 | Tragic 63.0% |
| Immigrants | Belgium | 0.2 /100 | #278 | Tragic 63.0% |
| Immigrants | Yemen | 0.2 /100 | #279 | Tragic 63.0% |
| Immigrants | Bulgaria | 0.2 /100 | #280 | Tragic 63.0% |
| Estonians | 0.2 /100 | #281 | Tragic 62.9% |
| New Zealanders | 0.1 /100 | #282 | Tragic 62.9% |
| Immigrants | Denmark | 0.1 /100 | #283 | Tragic 62.9% |
| Australians | 0.1 /100 | #284 | Tragic 62.8% |
| Mongolians | 0.1 /100 | #285 | Tragic 62.8% |
| British West Indians | 0.1 /100 | #286 | Tragic 62.8% |
| Latvians | 0.1 /100 | #287 | Tragic 62.8% |
| Immigrants | Uganda | 0.1 /100 | #288 | Tragic 62.7% |
| Immigrants | Nepal | 0.1 /100 | #289 | Tragic 62.7% |