Albanian vs Immigrants from Barbados Family Households
COMPARE
Albanian
Immigrants from Barbados
Family Households
Family Households Comparison
Albanians
Immigrants from Barbados
63.5%
FAMILY HOUSEHOLDS
2.2/ 100
METRIC RATING
235th/ 347
METRIC RANK
63.2%
FAMILY HOUSEHOLDS
0.7/ 100
METRIC RATING
258th/ 347
METRIC RANK
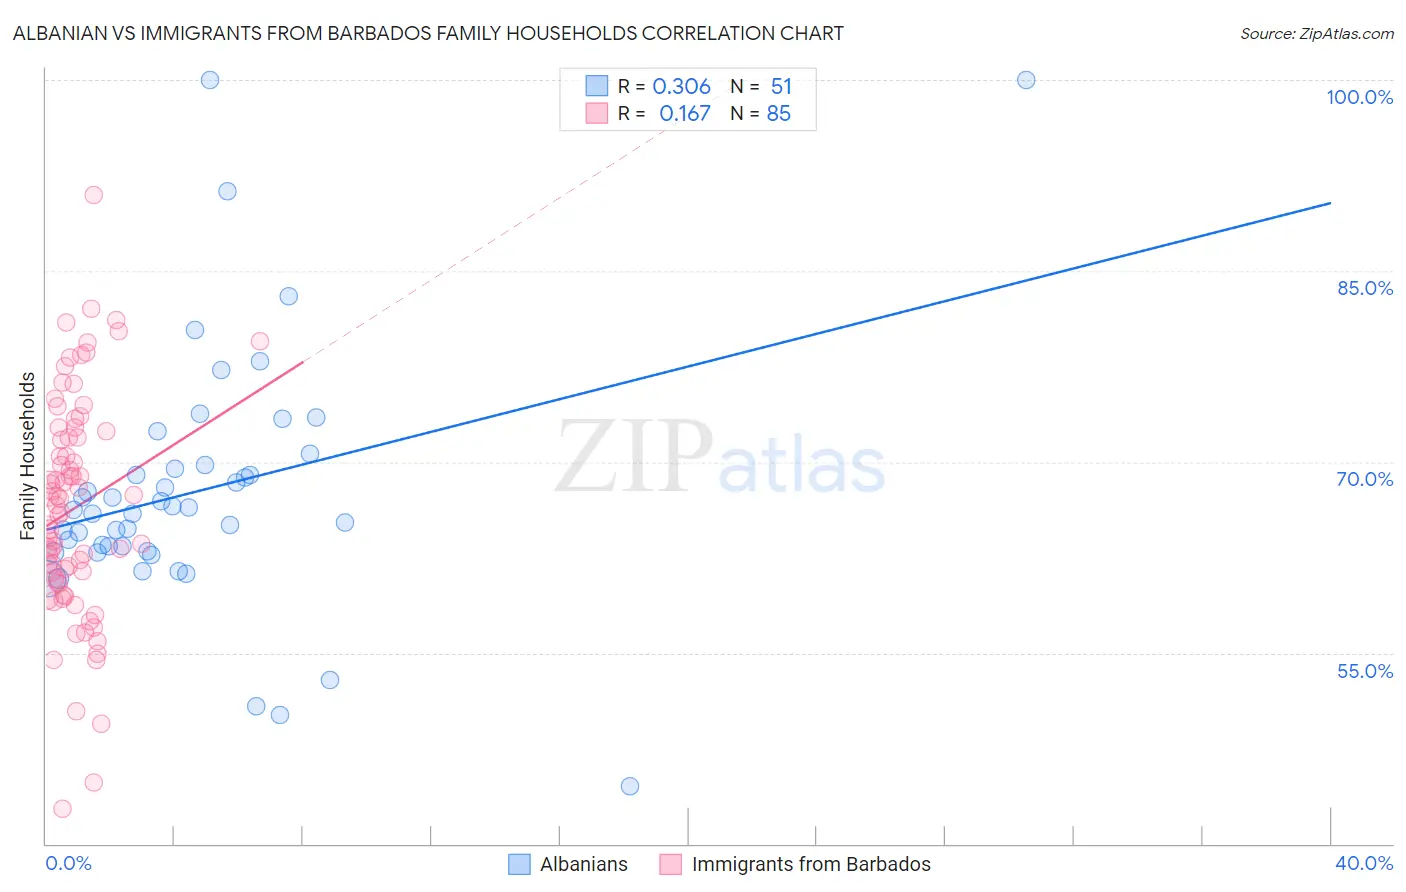
Albanian vs Immigrants from Barbados Family Households Correlation Chart
The statistical analysis conducted on geographies consisting of 193,187,165 people shows a mild positive correlation between the proportion of Albanians and percentage of family households in the United States with a correlation coefficient (R) of 0.306 and weighted average of 63.5%. Similarly, the statistical analysis conducted on geographies consisting of 112,769,646 people shows a poor positive correlation between the proportion of Immigrants from Barbados and percentage of family households in the United States with a correlation coefficient (R) of 0.167 and weighted average of 63.2%, a difference of 0.41%.
Family Households Correlation Summary
| Measurement | Albanian | Immigrants from Barbados |
| Minimum | 44.5% | 42.7% |
| Maximum | 100.0% | 91.0% |
| Range | 55.5% | 48.2% |
| Mean | 67.7% | 66.3% |
| Median | 66.2% | 66.6% |
| Interquartile 25% (IQ1) | 62.9% | 60.7% |
| Interquartile 75% (IQ3) | 69.7% | 72.2% |
| Interquartile Range (IQR) | 6.8% | 11.5% |
| Standard Deviation (Sample) | 10.2% | 8.7% |
| Standard Deviation (Population) | 10.1% | 8.6% |
Similar Demographics by Family Households
Demographics Similar to Albanians by Family Households
In terms of family households, the demographic groups most similar to Albanians are Ghanaian (63.5%, a difference of 0.010%), Comanche (63.5%, a difference of 0.020%), Immigrants from Zimbabwe (63.5%, a difference of 0.020%), Finnish (63.5%, a difference of 0.030%), and Immigrants from Armenia (63.5%, a difference of 0.050%).
| Demographics | Rating | Rank | Family Households |
| Blackfeet | 3.6 /100 | #228 | Tragic 63.6% |
| Bulgarians | 3.4 /100 | #229 | Tragic 63.6% |
| Immigrants | Brazil | 3.0 /100 | #230 | Tragic 63.6% |
| Immigrants | Greece | 2.9 /100 | #231 | Tragic 63.5% |
| Immigrants | Northern Africa | 2.6 /100 | #232 | Tragic 63.5% |
| Immigrants | Armenia | 2.6 /100 | #233 | Tragic 63.5% |
| Finns | 2.3 /100 | #234 | Tragic 63.5% |
| Albanians | 2.2 /100 | #235 | Tragic 63.5% |
| Ghanaians | 2.1 /100 | #236 | Tragic 63.5% |
| Comanche | 2.1 /100 | #237 | Tragic 63.5% |
| Immigrants | Zimbabwe | 2.0 /100 | #238 | Tragic 63.5% |
| Aleuts | 1.9 /100 | #239 | Tragic 63.4% |
| South Africans | 1.9 /100 | #240 | Tragic 63.4% |
| Immigrants | St. Vincent and the Grenadines | 1.9 /100 | #241 | Tragic 63.4% |
| Immigrants | Israel | 1.8 /100 | #242 | Tragic 63.4% |
Demographics Similar to Immigrants from Barbados by Family Households
In terms of family households, the demographic groups most similar to Immigrants from Barbados are Immigrants from Western Europe (63.2%, a difference of 0.010%), Cypriot (63.2%, a difference of 0.030%), Immigrants from Russia (63.2%, a difference of 0.050%), Immigrants from Ireland (63.2%, a difference of 0.060%), and Icelander (63.3%, a difference of 0.070%).
| Demographics | Rating | Rank | Family Households |
| Taiwanese | 1.2 /100 | #251 | Tragic 63.3% |
| Bahamians | 1.1 /100 | #252 | Tragic 63.3% |
| Immigrants | Dominican Republic | 1.0 /100 | #253 | Tragic 63.3% |
| Slovaks | 1.0 /100 | #254 | Tragic 63.3% |
| Potawatomi | 1.0 /100 | #255 | Tragic 63.3% |
| Luxembourgers | 0.9 /100 | #256 | Tragic 63.3% |
| Icelanders | 0.8 /100 | #257 | Tragic 63.3% |
| Immigrants | Barbados | 0.7 /100 | #258 | Tragic 63.2% |
| Immigrants | Western Europe | 0.6 /100 | #259 | Tragic 63.2% |
| Cypriots | 0.6 /100 | #260 | Tragic 63.2% |
| Immigrants | Russia | 0.6 /100 | #261 | Tragic 63.2% |
| Immigrants | Ireland | 0.6 /100 | #262 | Tragic 63.2% |
| Cheyenne | 0.5 /100 | #263 | Tragic 63.2% |
| Kenyans | 0.5 /100 | #264 | Tragic 63.2% |
| Colville | 0.5 /100 | #265 | Tragic 63.2% |