Immigrants from Northern Europe vs Immigrants from Sierra Leone Family Households
COMPARE
Immigrants from Northern Europe
Immigrants from Sierra Leone
Family Households
Family Households Comparison
Immigrants from Northern Europe
Immigrants from Sierra Leone
63.8%
FAMILY HOUSEHOLDS
8.8/ 100
METRIC RATING
213th/ 347
METRIC RANK
64.3%
FAMILY HOUSEHOLDS
52.5/ 100
METRIC RATING
173rd/ 347
METRIC RANK
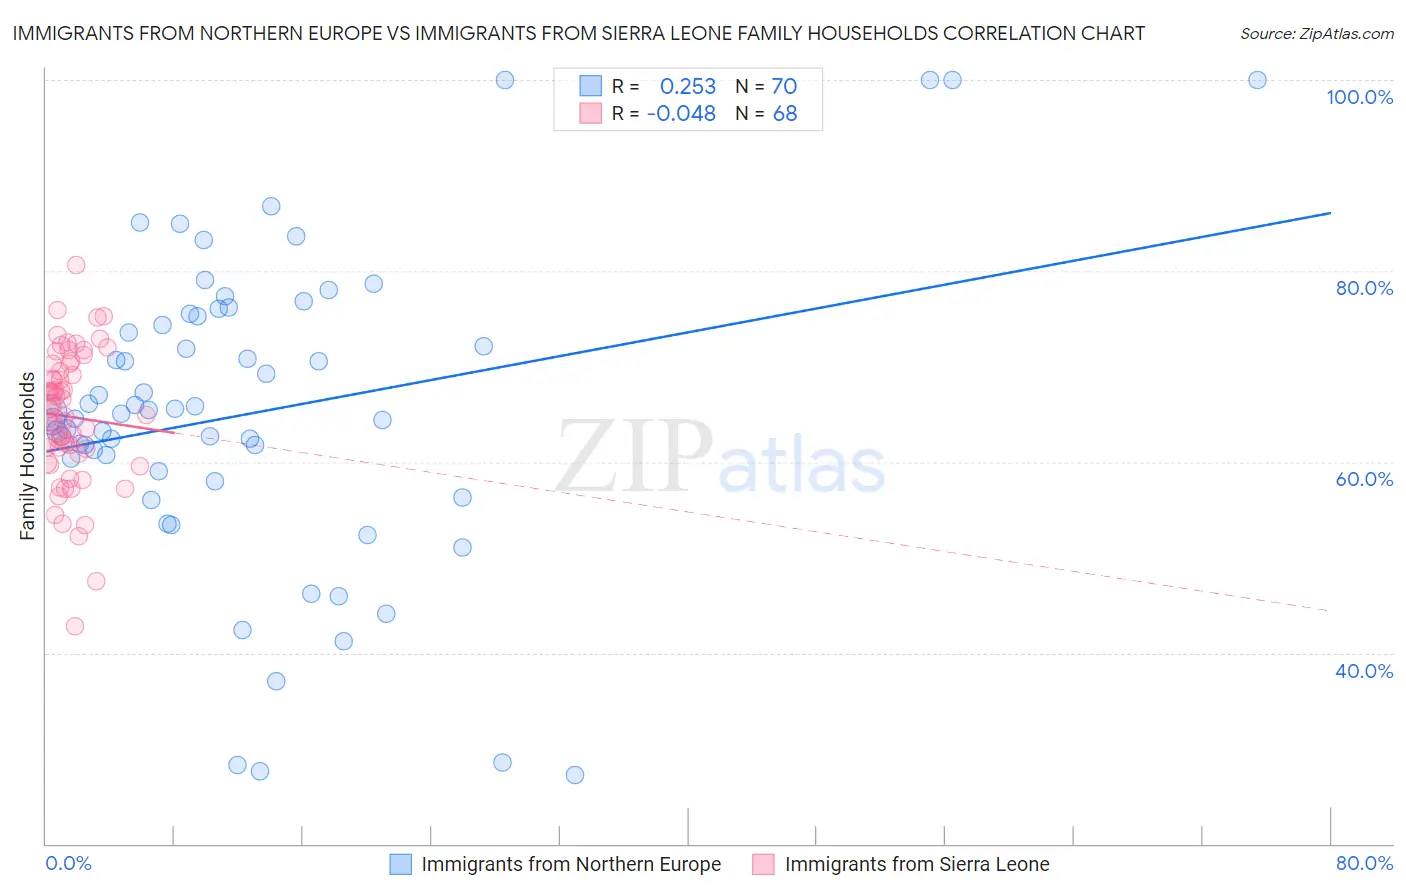
Immigrants from Northern Europe vs Immigrants from Sierra Leone Family Households Correlation Chart
The statistical analysis conducted on geographies consisting of 476,950,650 people shows a weak positive correlation between the proportion of Immigrants from Northern Europe and percentage of family households in the United States with a correlation coefficient (R) of 0.253 and weighted average of 63.8%. Similarly, the statistical analysis conducted on geographies consisting of 101,647,201 people shows no correlation between the proportion of Immigrants from Sierra Leone and percentage of family households in the United States with a correlation coefficient (R) of -0.048 and weighted average of 64.3%, a difference of 0.82%.
Family Households Correlation Summary
| Measurement | Immigrants from Northern Europe | Immigrants from Sierra Leone |
| Minimum | 27.1% | 42.7% |
| Maximum | 100.0% | 80.6% |
| Range | 72.9% | 37.9% |
| Mean | 65.2% | 64.7% |
| Median | 65.1% | 65.3% |
| Interquartile 25% (IQ1) | 59.0% | 61.1% |
| Interquartile 75% (IQ3) | 75.3% | 69.8% |
| Interquartile Range (IQR) | 16.3% | 8.7% |
| Standard Deviation (Sample) | 16.2% | 7.0% |
| Standard Deviation (Population) | 16.1% | 6.9% |
Similar Demographics by Family Households
Demographics Similar to Immigrants from Northern Europe by Family Households
In terms of family households, the demographic groups most similar to Immigrants from Northern Europe are Shoshone (63.8%, a difference of 0.020%), Immigrants from Netherlands (63.8%, a difference of 0.020%), Immigrants from Thailand (63.8%, a difference of 0.030%), Celtic (63.8%, a difference of 0.040%), and Belgian (63.8%, a difference of 0.060%).
| Demographics | Rating | Rank | Family Households |
| Immigrants | Lithuania | 12.1 /100 | #206 | Poor 63.9% |
| Nigerians | 11.5 /100 | #207 | Poor 63.9% |
| Immigrants | Bangladesh | 11.4 /100 | #208 | Poor 63.9% |
| Sierra Leoneans | 11.2 /100 | #209 | Poor 63.9% |
| Immigrants | Thailand | 9.6 /100 | #210 | Tragic 63.8% |
| Shoshone | 9.4 /100 | #211 | Tragic 63.8% |
| Immigrants | Netherlands | 9.4 /100 | #212 | Tragic 63.8% |
| Immigrants | Northern Europe | 8.8 /100 | #213 | Tragic 63.8% |
| Celtics | 8.0 /100 | #214 | Tragic 63.8% |
| Belgians | 7.6 /100 | #215 | Tragic 63.8% |
| Croatians | 7.3 /100 | #216 | Tragic 63.8% |
| Osage | 7.0 /100 | #217 | Tragic 63.7% |
| Marshallese | 6.9 /100 | #218 | Tragic 63.7% |
| Macedonians | 6.5 /100 | #219 | Tragic 63.7% |
| Immigrants | Europe | 6.4 /100 | #220 | Tragic 63.7% |
Demographics Similar to Immigrants from Sierra Leone by Family Households
In terms of family households, the demographic groups most similar to Immigrants from Sierra Leone are Dutch West Indian (64.3%, a difference of 0.020%), Ute (64.3%, a difference of 0.030%), Immigrants from Germany (64.3%, a difference of 0.030%), Iraqi (64.4%, a difference of 0.050%), and Armenian (64.4%, a difference of 0.050%).
| Demographics | Rating | Rank | Family Households |
| Scotch-Irish | 59.2 /100 | #166 | Average 64.4% |
| Irish | 57.9 /100 | #167 | Average 64.4% |
| Hondurans | 57.5 /100 | #168 | Average 64.4% |
| Iraqis | 56.0 /100 | #169 | Average 64.4% |
| Armenians | 55.9 /100 | #170 | Average 64.4% |
| Ute | 54.6 /100 | #171 | Average 64.3% |
| Dutch West Indians | 53.9 /100 | #172 | Average 64.3% |
| Immigrants | Sierra Leone | 52.5 /100 | #173 | Average 64.3% |
| Immigrants | Germany | 50.0 /100 | #174 | Average 64.3% |
| Bangladeshis | 44.3 /100 | #175 | Average 64.3% |
| Vietnamese | 43.6 /100 | #176 | Average 64.2% |
| Immigrants | Micronesia | 42.3 /100 | #177 | Average 64.2% |
| Jamaicans | 40.6 /100 | #178 | Average 64.2% |
| Immigrants | Ukraine | 38.2 /100 | #179 | Fair 64.2% |
| Immigrants | Honduras | 35.0 /100 | #180 | Fair 64.2% |