Alaskan Athabascan vs Immigrants from Iran Professional Degree
COMPARE
Alaskan Athabascan
Immigrants from Iran
Professional Degree
Professional Degree Comparison
Alaskan Athabascans
Immigrants from Iran
3.8%
PROFESSIONAL DEGREE
2.3/ 100
METRIC RATING
241st/ 347
METRIC RANK
7.3%
PROFESSIONAL DEGREE
100.0/ 100
METRIC RATING
5th/ 347
METRIC RANK
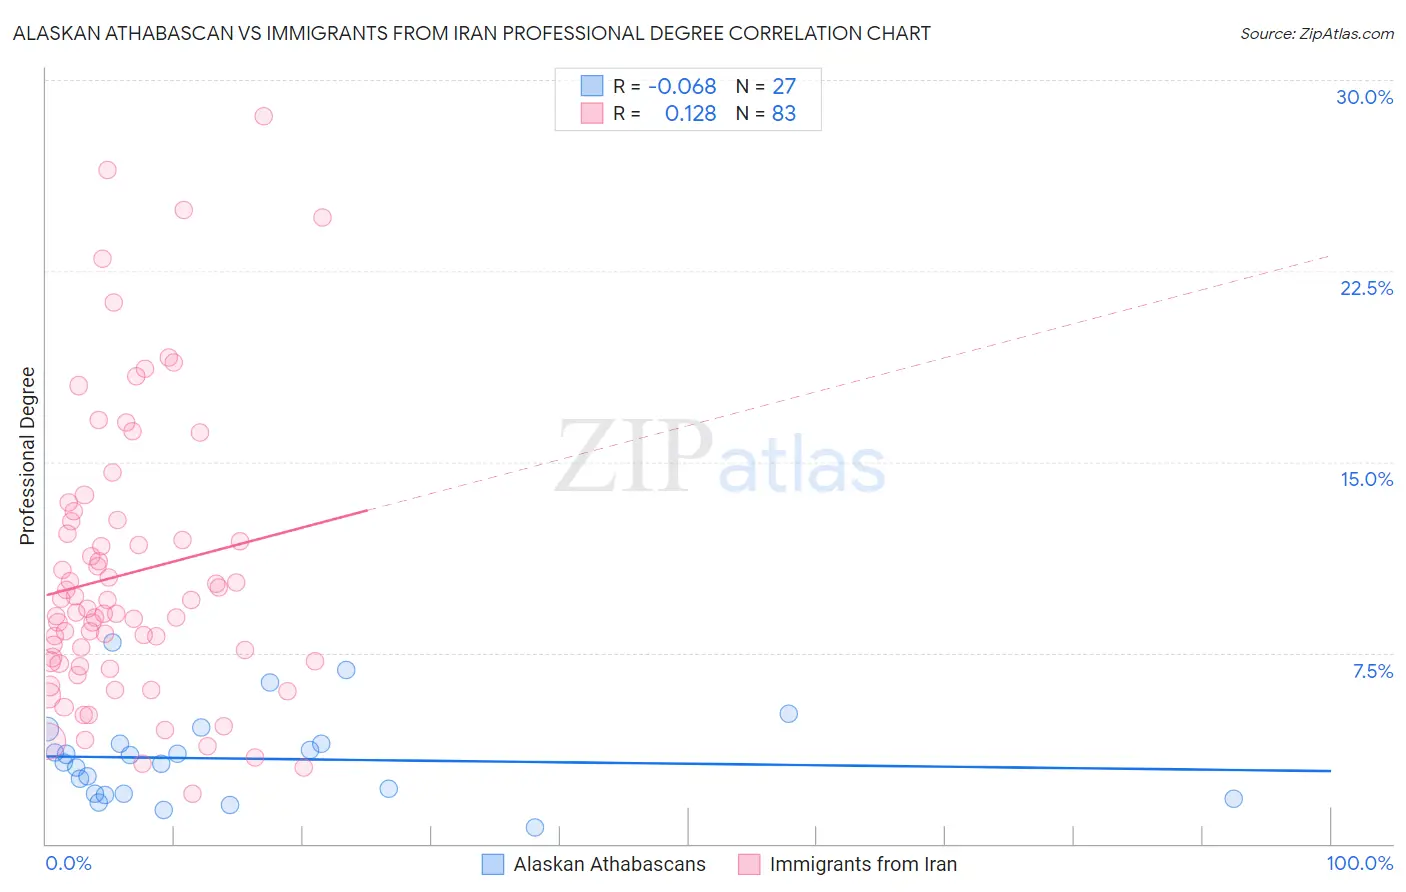
Alaskan Athabascan vs Immigrants from Iran Professional Degree Correlation Chart
The statistical analysis conducted on geographies consisting of 45,732,326 people shows a slight negative correlation between the proportion of Alaskan Athabascans and percentage of population with at least professional degree education in the United States with a correlation coefficient (R) of -0.068 and weighted average of 3.8%. Similarly, the statistical analysis conducted on geographies consisting of 279,790,021 people shows a poor positive correlation between the proportion of Immigrants from Iran and percentage of population with at least professional degree education in the United States with a correlation coefficient (R) of 0.128 and weighted average of 7.3%, a difference of 92.6%.
Professional Degree Correlation Summary
| Measurement | Alaskan Athabascan | Immigrants from Iran |
| Minimum | 0.64% | 1.9% |
| Maximum | 7.9% | 28.6% |
| Range | 7.2% | 26.6% |
| Mean | 3.3% | 10.6% |
| Median | 3.2% | 9.1% |
| Interquartile 25% (IQ1) | 2.0% | 7.1% |
| Interquartile 75% (IQ3) | 3.9% | 12.7% |
| Interquartile Range (IQR) | 2.0% | 5.6% |
| Standard Deviation (Sample) | 1.7% | 5.6% |
| Standard Deviation (Population) | 1.7% | 5.6% |
Similar Demographics by Professional Degree
Demographics Similar to Alaskan Athabascans by Professional Degree
In terms of professional degree, the demographic groups most similar to Alaskan Athabascans are Native Hawaiian (3.8%, a difference of 0.0%), Immigrants from Ecuador (3.8%, a difference of 0.020%), Guamanian/Chamorro (3.8%, a difference of 0.080%), British West Indian (3.8%, a difference of 0.25%), and Immigrants from Bahamas (3.8%, a difference of 0.51%).
| Demographics | Rating | Rank | Professional Degree |
| Immigrants | Nonimmigrants | 4.0 /100 | #234 | Tragic 3.9% |
| Immigrants | Barbados | 4.0 /100 | #235 | Tragic 3.9% |
| Spanish Americans | 3.8 /100 | #236 | Tragic 3.9% |
| Immigrants | Trinidad and Tobago | 3.8 /100 | #237 | Tragic 3.9% |
| Colville | 2.6 /100 | #238 | Tragic 3.8% |
| British West Indians | 2.4 /100 | #239 | Tragic 3.8% |
| Immigrants | Ecuador | 2.3 /100 | #240 | Tragic 3.8% |
| Alaskan Athabascans | 2.3 /100 | #241 | Tragic 3.8% |
| Native Hawaiians | 2.3 /100 | #242 | Tragic 3.8% |
| Guamanians/Chamorros | 2.2 /100 | #243 | Tragic 3.8% |
| Immigrants | Bahamas | 2.0 /100 | #244 | Tragic 3.8% |
| French American Indians | 1.7 /100 | #245 | Tragic 3.8% |
| Marshallese | 1.7 /100 | #246 | Tragic 3.8% |
| Guyanese | 1.6 /100 | #247 | Tragic 3.8% |
| Hmong | 1.6 /100 | #248 | Tragic 3.7% |
Demographics Similar to Immigrants from Iran by Professional Degree
In terms of professional degree, the demographic groups most similar to Immigrants from Iran are Okinawan (7.3%, a difference of 0.11%), Filipino (7.6%, a difference of 3.2%), Eastern European (7.1%, a difference of 3.3%), Immigrants from Switzerland (7.1%, a difference of 3.4%), and Immigrants from Taiwan (7.1%, a difference of 3.6%).
| Demographics | Rating | Rank | Professional Degree |
| Immigrants | Israel | 100.0 /100 | #1 | Exceptional 7.9% |
| Immigrants | Singapore | 100.0 /100 | #2 | Exceptional 7.7% |
| Iranians | 100.0 /100 | #3 | Exceptional 7.6% |
| Filipinos | 100.0 /100 | #4 | Exceptional 7.6% |
| Immigrants | Iran | 100.0 /100 | #5 | Exceptional 7.3% |
| Okinawans | 100.0 /100 | #6 | Exceptional 7.3% |
| Eastern Europeans | 100.0 /100 | #7 | Exceptional 7.1% |
| Immigrants | Switzerland | 100.0 /100 | #8 | Exceptional 7.1% |
| Immigrants | Taiwan | 100.0 /100 | #9 | Exceptional 7.1% |
| Immigrants | Belgium | 100.0 /100 | #10 | Exceptional 7.0% |
| Cypriots | 100.0 /100 | #11 | Exceptional 6.9% |
| Israelis | 100.0 /100 | #12 | Exceptional 6.9% |
| Immigrants | Australia | 100.0 /100 | #13 | Exceptional 6.9% |
| Immigrants | France | 100.0 /100 | #14 | Exceptional 6.8% |
| Immigrants | China | 100.0 /100 | #15 | Exceptional 6.7% |