Cree vs Immigrants from Iran Single Mother Households
COMPARE
Cree
Immigrants from Iran
Single Mother Households
Single Mother Households Comparison
Cree
Immigrants from Iran
6.7%
SINGLE MOTHER HOUSEHOLDS
11.9/ 100
METRIC RATING
205th/ 347
METRIC RANK
4.8%
SINGLE MOTHER HOUSEHOLDS
100.0/ 100
METRIC RATING
3rd/ 347
METRIC RANK
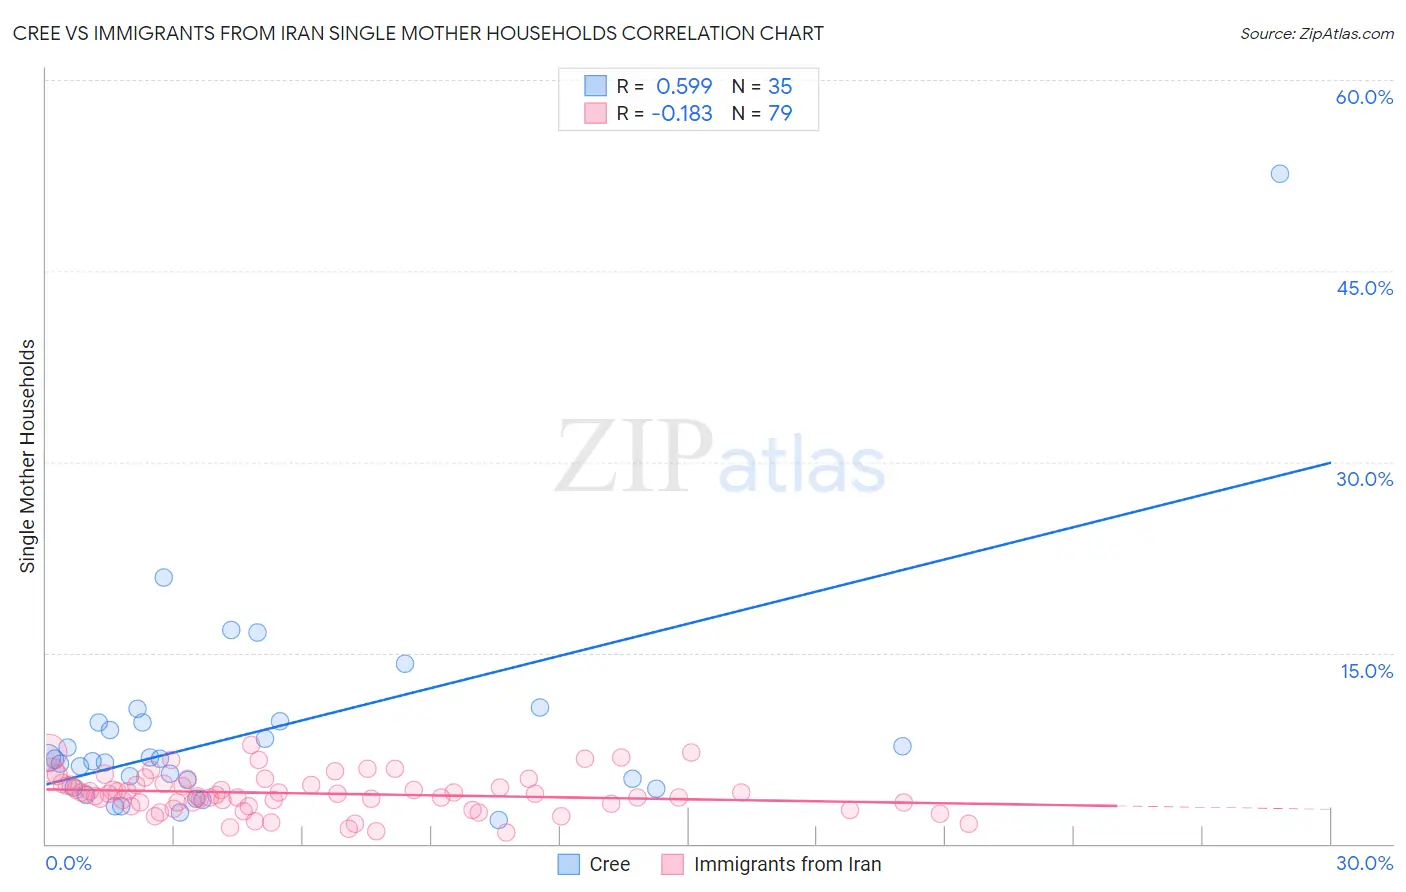
Cree vs Immigrants from Iran Single Mother Households Correlation Chart
The statistical analysis conducted on geographies consisting of 76,173,088 people shows a substantial positive correlation between the proportion of Cree and percentage of single mother households in the United States with a correlation coefficient (R) of 0.599 and weighted average of 6.7%. Similarly, the statistical analysis conducted on geographies consisting of 279,447,711 people shows a poor negative correlation between the proportion of Immigrants from Iran and percentage of single mother households in the United States with a correlation coefficient (R) of -0.183 and weighted average of 4.8%, a difference of 38.5%.
Single Mother Households Correlation Summary
| Measurement | Cree | Immigrants from Iran |
| Minimum | 1.9% | 0.87% |
| Maximum | 52.6% | 7.8% |
| Range | 50.8% | 6.9% |
| Mean | 8.7% | 4.0% |
| Median | 6.6% | 3.9% |
| Interquartile 25% (IQ1) | 4.4% | 3.2% |
| Interquartile 75% (IQ3) | 9.5% | 4.7% |
| Interquartile Range (IQR) | 5.1% | 1.5% |
| Standard Deviation (Sample) | 8.7% | 1.5% |
| Standard Deviation (Population) | 8.6% | 1.5% |
Similar Demographics by Single Mother Households
Demographics Similar to Cree by Single Mother Households
In terms of single mother households, the demographic groups most similar to Cree are Immigrants from Fiji (6.7%, a difference of 0.020%), Immigrants from Peru (6.7%, a difference of 0.030%), German Russian (6.7%, a difference of 0.080%), Immigrants from South America (6.7%, a difference of 0.080%), and Guamanian/Chamorro (6.6%, a difference of 0.13%).
| Demographics | Rating | Rank | Single Mother Households |
| Hawaiians | 16.1 /100 | #198 | Poor 6.6% |
| Potawatomi | 15.5 /100 | #199 | Poor 6.6% |
| Immigrants | Ethiopia | 14.7 /100 | #200 | Poor 6.6% |
| Venezuelans | 12.9 /100 | #201 | Poor 6.6% |
| Guamanians/Chamorros | 12.4 /100 | #202 | Poor 6.6% |
| Immigrants | Peru | 12.0 /100 | #203 | Poor 6.7% |
| Immigrants | Fiji | 11.9 /100 | #204 | Poor 6.7% |
| Cree | 11.9 /100 | #205 | Poor 6.7% |
| German Russians | 11.5 /100 | #206 | Poor 6.7% |
| Immigrants | South America | 11.5 /100 | #207 | Poor 6.7% |
| Vietnamese | 11.3 /100 | #208 | Poor 6.7% |
| Immigrants | Colombia | 10.5 /100 | #209 | Poor 6.7% |
| Immigrants | Nonimmigrants | 10.4 /100 | #210 | Poor 6.7% |
| Immigrants | Venezuela | 8.5 /100 | #211 | Tragic 6.7% |
| Immigrants | Eritrea | 8.4 /100 | #212 | Tragic 6.7% |
Demographics Similar to Immigrants from Iran by Single Mother Households
In terms of single mother households, the demographic groups most similar to Immigrants from Iran are Assyrian/Chaldean/Syriac (4.8%, a difference of 0.080%), Immigrants from Hong Kong (4.8%, a difference of 0.60%), Filipino (4.7%, a difference of 2.3%), Immigrants from Taiwan (4.7%, a difference of 2.6%), and Immigrants from Singapore (5.0%, a difference of 3.2%).
| Demographics | Rating | Rank | Single Mother Households |
| Immigrants | Taiwan | 100.0 /100 | #1 | Exceptional 4.7% |
| Filipinos | 100.0 /100 | #2 | Exceptional 4.7% |
| Immigrants | Iran | 100.0 /100 | #3 | Exceptional 4.8% |
| Assyrians/Chaldeans/Syriacs | 100.0 /100 | #4 | Exceptional 4.8% |
| Immigrants | Hong Kong | 100.0 /100 | #5 | Exceptional 4.8% |
| Immigrants | Singapore | 100.0 /100 | #6 | Exceptional 5.0% |
| Iranians | 100.0 /100 | #7 | Exceptional 5.0% |
| Immigrants | Ireland | 99.9 /100 | #8 | Exceptional 5.0% |
| Okinawans | 99.9 /100 | #9 | Exceptional 5.0% |
| Immigrants | Israel | 99.9 /100 | #10 | Exceptional 5.0% |
| Immigrants | China | 99.9 /100 | #11 | Exceptional 5.1% |
| Cypriots | 99.9 /100 | #12 | Exceptional 5.1% |
| Immigrants | India | 99.9 /100 | #13 | Exceptional 5.1% |
| Immigrants | Australia | 99.9 /100 | #14 | Exceptional 5.1% |
| Immigrants | Eastern Asia | 99.9 /100 | #15 | Exceptional 5.1% |