Guatemalan vs Immigrants from Iran Single Mother Households
COMPARE
Guatemalan
Immigrants from Iran
Single Mother Households
Single Mother Households Comparison
Guatemalans
Immigrants from Iran
7.7%
SINGLE MOTHER HOUSEHOLDS
0.0/ 100
METRIC RATING
282nd/ 347
METRIC RANK
4.8%
SINGLE MOTHER HOUSEHOLDS
100.0/ 100
METRIC RATING
3rd/ 347
METRIC RANK
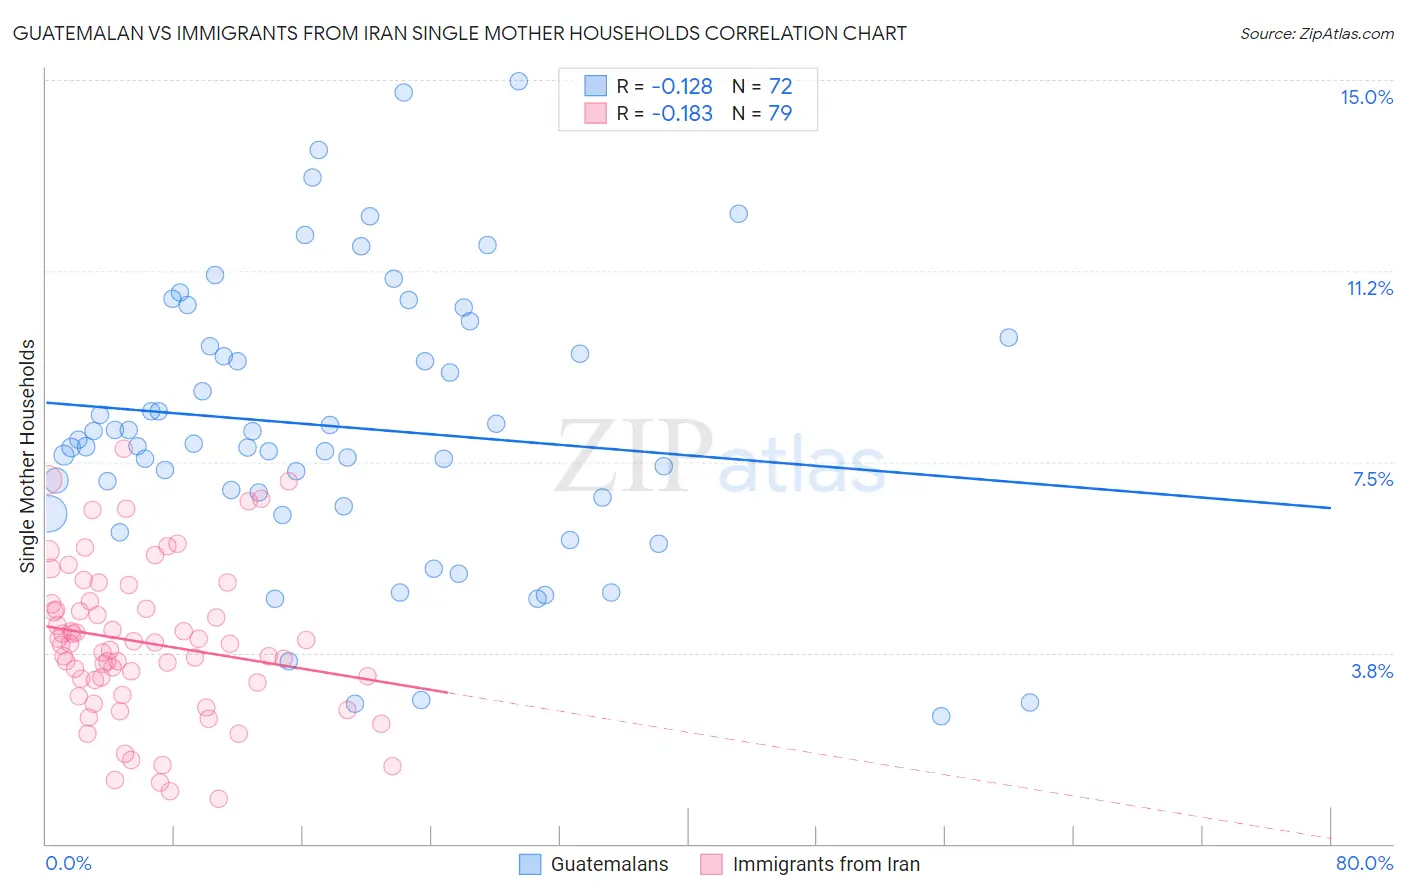
Guatemalan vs Immigrants from Iran Single Mother Households Correlation Chart
The statistical analysis conducted on geographies consisting of 408,771,433 people shows a poor negative correlation between the proportion of Guatemalans and percentage of single mother households in the United States with a correlation coefficient (R) of -0.128 and weighted average of 7.7%. Similarly, the statistical analysis conducted on geographies consisting of 279,447,711 people shows a poor negative correlation between the proportion of Immigrants from Iran and percentage of single mother households in the United States with a correlation coefficient (R) of -0.183 and weighted average of 4.8%, a difference of 59.5%.
Single Mother Households Correlation Summary
| Measurement | Guatemalan | Immigrants from Iran |
| Minimum | 2.5% | 0.87% |
| Maximum | 15.0% | 7.8% |
| Range | 12.5% | 6.9% |
| Mean | 8.2% | 4.0% |
| Median | 7.8% | 3.9% |
| Interquartile 25% (IQ1) | 6.7% | 3.2% |
| Interquartile 75% (IQ3) | 9.9% | 4.7% |
| Interquartile Range (IQR) | 3.1% | 1.5% |
| Standard Deviation (Sample) | 2.7% | 1.5% |
| Standard Deviation (Population) | 2.7% | 1.5% |
Similar Demographics by Single Mother Households
Demographics Similar to Guatemalans by Single Mother Households
In terms of single mother households, the demographic groups most similar to Guatemalans are Immigrants from Sierra Leone (7.7%, a difference of 0.020%), Immigrants from Laos (7.7%, a difference of 0.020%), Nigerian (7.7%, a difference of 0.030%), Immigrants from El Salvador (7.6%, a difference of 0.54%), and Immigrants from Belize (7.7%, a difference of 0.63%).
| Demographics | Rating | Rank | Single Mother Households |
| Central American Indians | 0.1 /100 | #275 | Tragic 7.6% |
| Guyanese | 0.1 /100 | #276 | Tragic 7.6% |
| Immigrants | Trinidad and Tobago | 0.1 /100 | #277 | Tragic 7.6% |
| Central Americans | 0.1 /100 | #278 | Tragic 7.6% |
| Immigrants | El Salvador | 0.0 /100 | #279 | Tragic 7.6% |
| Immigrants | Sierra Leone | 0.0 /100 | #280 | Tragic 7.7% |
| Immigrants | Laos | 0.0 /100 | #281 | Tragic 7.7% |
| Guatemalans | 0.0 /100 | #282 | Tragic 7.7% |
| Nigerians | 0.0 /100 | #283 | Tragic 7.7% |
| Immigrants | Belize | 0.0 /100 | #284 | Tragic 7.7% |
| Trinidadians and Tobagonians | 0.0 /100 | #285 | Tragic 7.7% |
| Immigrants | Middle Africa | 0.0 /100 | #286 | Tragic 7.7% |
| Immigrants | Guatemala | 0.0 /100 | #287 | Tragic 7.7% |
| Sierra Leoneans | 0.0 /100 | #288 | Tragic 7.7% |
| Sub-Saharan Africans | 0.0 /100 | #289 | Tragic 7.8% |
Demographics Similar to Immigrants from Iran by Single Mother Households
In terms of single mother households, the demographic groups most similar to Immigrants from Iran are Assyrian/Chaldean/Syriac (4.8%, a difference of 0.080%), Immigrants from Hong Kong (4.8%, a difference of 0.60%), Filipino (4.7%, a difference of 2.3%), Immigrants from Taiwan (4.7%, a difference of 2.6%), and Immigrants from Singapore (5.0%, a difference of 3.2%).
| Demographics | Rating | Rank | Single Mother Households |
| Immigrants | Taiwan | 100.0 /100 | #1 | Exceptional 4.7% |
| Filipinos | 100.0 /100 | #2 | Exceptional 4.7% |
| Immigrants | Iran | 100.0 /100 | #3 | Exceptional 4.8% |
| Assyrians/Chaldeans/Syriacs | 100.0 /100 | #4 | Exceptional 4.8% |
| Immigrants | Hong Kong | 100.0 /100 | #5 | Exceptional 4.8% |
| Immigrants | Singapore | 100.0 /100 | #6 | Exceptional 5.0% |
| Iranians | 100.0 /100 | #7 | Exceptional 5.0% |
| Immigrants | Ireland | 99.9 /100 | #8 | Exceptional 5.0% |
| Okinawans | 99.9 /100 | #9 | Exceptional 5.0% |
| Immigrants | Israel | 99.9 /100 | #10 | Exceptional 5.0% |
| Immigrants | China | 99.9 /100 | #11 | Exceptional 5.1% |
| Cypriots | 99.9 /100 | #12 | Exceptional 5.1% |
| Immigrants | India | 99.9 /100 | #13 | Exceptional 5.1% |
| Immigrants | Australia | 99.9 /100 | #14 | Exceptional 5.1% |
| Immigrants | Eastern Asia | 99.9 /100 | #15 | Exceptional 5.1% |