Alaskan Athabascan vs Chinese Single Father Households
COMPARE
Alaskan Athabascan
Chinese
Single Father Households
Single Father Households Comparison
Alaskan Athabascans
Chinese
3.4%
SINGLE FATHER HOUSEHOLDS
0.0/ 100
METRIC RATING
339th/ 347
METRIC RANK
2.0%
SINGLE FATHER HOUSEHOLDS
100.0/ 100
METRIC RATING
32nd/ 347
METRIC RANK
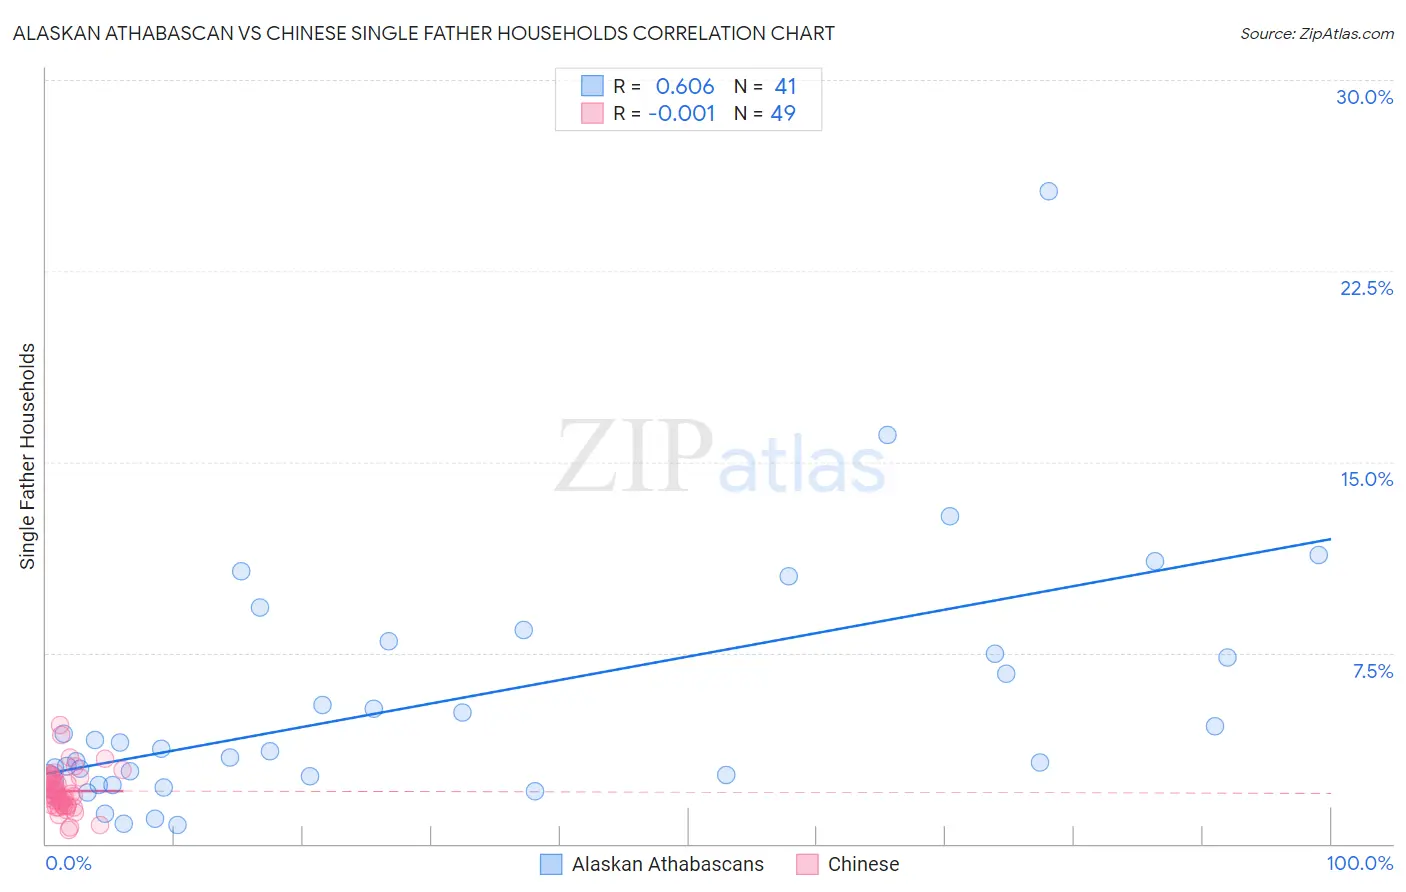
Alaskan Athabascan vs Chinese Single Father Households Correlation Chart
The statistical analysis conducted on geographies consisting of 45,717,471 people shows a significant positive correlation between the proportion of Alaskan Athabascans and percentage of single father households in the United States with a correlation coefficient (R) of 0.606 and weighted average of 3.4%. Similarly, the statistical analysis conducted on geographies consisting of 64,726,791 people shows no correlation between the proportion of Chinese and percentage of single father households in the United States with a correlation coefficient (R) of -0.001 and weighted average of 2.0%, a difference of 71.2%.
Single Father Households Correlation Summary
| Measurement | Alaskan Athabascan | Chinese |
| Minimum | 0.71% | 0.52% |
| Maximum | 25.6% | 4.6% |
| Range | 24.9% | 4.1% |
| Mean | 5.6% | 2.1% |
| Median | 3.7% | 2.0% |
| Interquartile 25% (IQ1) | 2.6% | 1.5% |
| Interquartile 75% (IQ3) | 7.7% | 2.6% |
| Interquartile Range (IQR) | 5.2% | 1.0% |
| Standard Deviation (Sample) | 4.9% | 0.81% |
| Standard Deviation (Population) | 4.8% | 0.80% |
Similar Demographics by Single Father Households
Demographics Similar to Alaskan Athabascans by Single Father Households
In terms of single father households, the demographic groups most similar to Alaskan Athabascans are Sioux (3.3%, a difference of 1.5%), Pueblo (3.3%, a difference of 2.1%), Paiute (3.3%, a difference of 2.4%), Colville (3.3%, a difference of 2.4%), and Yuman (3.3%, a difference of 2.5%).
| Demographics | Rating | Rank | Single Father Households |
| Yaqui | 0.0 /100 | #332 | Tragic 3.2% |
| Natives/Alaskans | 0.0 /100 | #333 | Tragic 3.2% |
| Yuman | 0.0 /100 | #334 | Tragic 3.3% |
| Colville | 0.0 /100 | #335 | Tragic 3.3% |
| Paiute | 0.0 /100 | #336 | Tragic 3.3% |
| Pueblo | 0.0 /100 | #337 | Tragic 3.3% |
| Sioux | 0.0 /100 | #338 | Tragic 3.3% |
| Alaskan Athabascans | 0.0 /100 | #339 | Tragic 3.4% |
| Alaska Natives | 0.0 /100 | #340 | Tragic 3.5% |
| Crow | 0.0 /100 | #341 | Tragic 3.5% |
| Tohono O'odham | 0.0 /100 | #342 | Tragic 3.8% |
| Pima | 0.0 /100 | #343 | Tragic 4.2% |
| Yakama | 0.0 /100 | #344 | Tragic 4.2% |
| Menominee | 0.0 /100 | #345 | Tragic 4.2% |
| Inupiat | 0.0 /100 | #346 | Tragic 4.9% |
Demographics Similar to Chinese by Single Father Households
In terms of single father households, the demographic groups most similar to Chinese are Israeli (2.0%, a difference of 0.040%), Cambodian (2.0%, a difference of 0.070%), Bulgarian (2.0%, a difference of 0.090%), Immigrants from Japan (2.0%, a difference of 0.18%), and Turkish (2.0%, a difference of 0.21%).
| Demographics | Rating | Rank | Single Father Households |
| Eastern Europeans | 100.0 /100 | #25 | Exceptional 2.0% |
| Assyrians/Chaldeans/Syriacs | 100.0 /100 | #26 | Exceptional 2.0% |
| Immigrants | South Central Asia | 100.0 /100 | #27 | Exceptional 2.0% |
| Immigrants | Japan | 100.0 /100 | #28 | Exceptional 2.0% |
| Bulgarians | 100.0 /100 | #29 | Exceptional 2.0% |
| Cambodians | 100.0 /100 | #30 | Exceptional 2.0% |
| Israelis | 100.0 /100 | #31 | Exceptional 2.0% |
| Chinese | 100.0 /100 | #32 | Exceptional 2.0% |
| Turks | 100.0 /100 | #33 | Exceptional 2.0% |
| Immigrants | Australia | 100.0 /100 | #34 | Exceptional 2.0% |
| Albanians | 100.0 /100 | #35 | Exceptional 2.0% |
| Immigrants | Belgium | 100.0 /100 | #36 | Exceptional 2.0% |
| Immigrants | St. Vincent and the Grenadines | 100.0 /100 | #37 | Exceptional 2.0% |
| Immigrants | Eastern Europe | 100.0 /100 | #38 | Exceptional 2.0% |
| Immigrants | Sri Lanka | 100.0 /100 | #39 | Exceptional 2.0% |