Nonimmigrants vs Chinese Single Father Households
COMPARE
Nonimmigrants
Chinese
Single Father Households
Single Father Households Comparison
Nonimmigrants
Chinese
2.4%
SINGLE FATHER HOUSEHOLDS
7.6/ 100
METRIC RATING
231st/ 347
METRIC RANK
2.0%
SINGLE FATHER HOUSEHOLDS
100.0/ 100
METRIC RATING
32nd/ 347
METRIC RANK
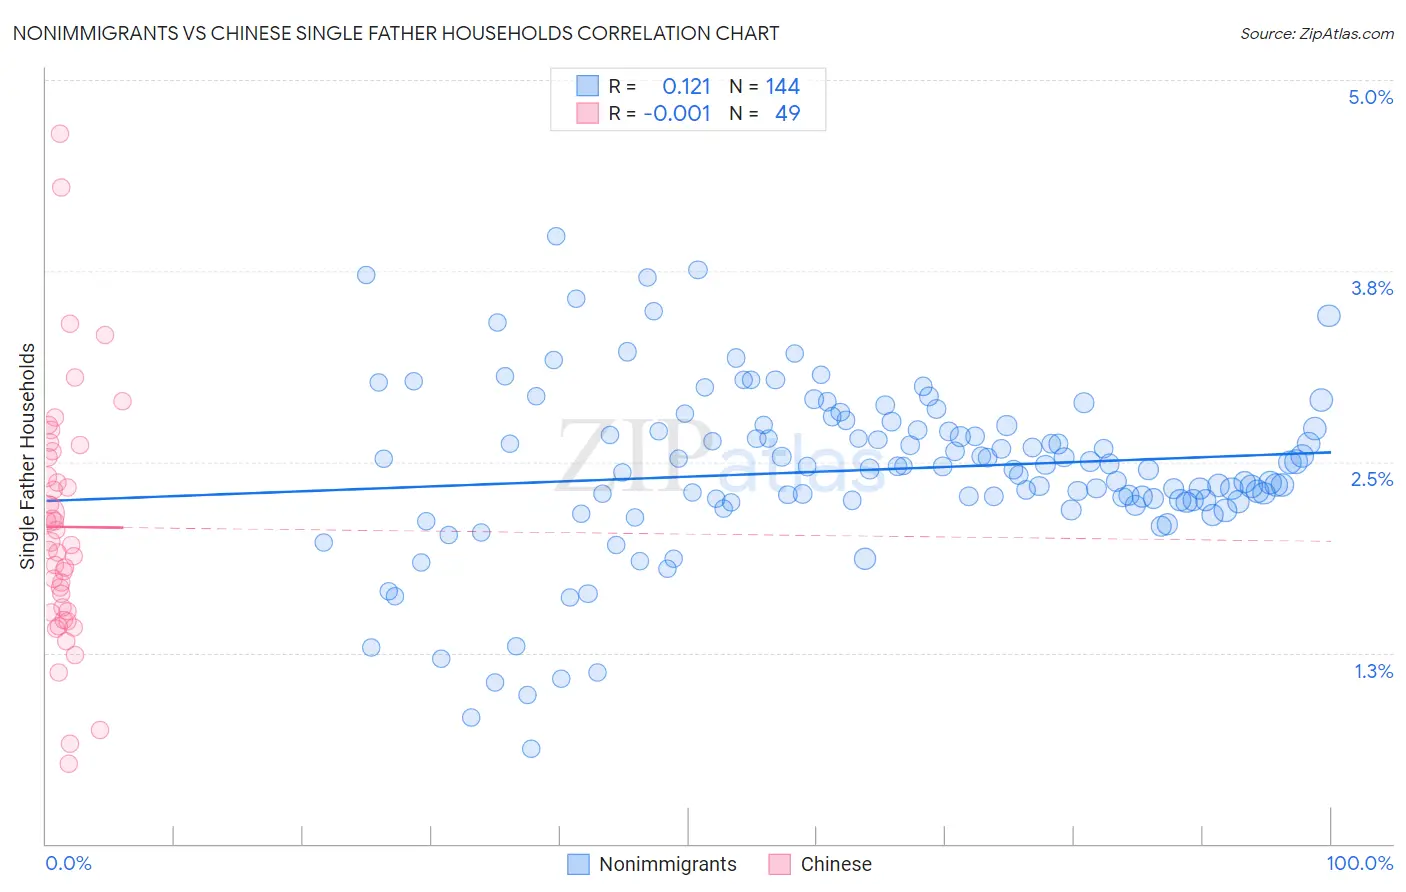
Nonimmigrants vs Chinese Single Father Households Correlation Chart
The statistical analysis conducted on geographies consisting of 565,890,376 people shows a poor positive correlation between the proportion of Nonimmigrants and percentage of single father households in the United States with a correlation coefficient (R) of 0.121 and weighted average of 2.4%. Similarly, the statistical analysis conducted on geographies consisting of 64,726,791 people shows no correlation between the proportion of Chinese and percentage of single father households in the United States with a correlation coefficient (R) of -0.001 and weighted average of 2.0%, a difference of 24.0%.
Single Father Households Correlation Summary
| Measurement | Nonimmigrants | Chinese |
| Minimum | 0.62% | 0.52% |
| Maximum | 4.0% | 4.6% |
| Range | 3.4% | 4.1% |
| Mean | 2.4% | 2.1% |
| Median | 2.5% | 2.0% |
| Interquartile 25% (IQ1) | 2.2% | 1.5% |
| Interquartile 75% (IQ3) | 2.7% | 2.6% |
| Interquartile Range (IQR) | 0.48% | 1.0% |
| Standard Deviation (Sample) | 0.56% | 0.81% |
| Standard Deviation (Population) | 0.56% | 0.80% |
Similar Demographics by Single Father Households
Demographics Similar to Nonimmigrants by Single Father Households
In terms of single father households, the demographic groups most similar to Nonimmigrants are Pennsylvania German (2.4%, a difference of 0.080%), Immigrants from Western Africa (2.4%, a difference of 0.14%), Subsaharan African (2.4%, a difference of 0.16%), Immigrants from Zaire (2.4%, a difference of 0.25%), and African (2.5%, a difference of 0.34%).
| Demographics | Rating | Rank | Single Father Households |
| Immigrants | Bahamas | 10.6 /100 | #224 | Poor 2.4% |
| Marshallese | 9.7 /100 | #225 | Tragic 2.4% |
| Blacks/African Americans | 9.7 /100 | #226 | Tragic 2.4% |
| Americans | 9.3 /100 | #227 | Tragic 2.4% |
| Immigrants | Ghana | 9.1 /100 | #228 | Tragic 2.4% |
| Immigrants | Zaire | 8.6 /100 | #229 | Tragic 2.4% |
| Sub-Saharan Africans | 8.3 /100 | #230 | Tragic 2.4% |
| Immigrants | Nonimmigrants | 7.6 /100 | #231 | Tragic 2.4% |
| Pennsylvania Germans | 7.3 /100 | #232 | Tragic 2.4% |
| Immigrants | Western Africa | 7.0 /100 | #233 | Tragic 2.4% |
| Africans | 6.3 /100 | #234 | Tragic 2.5% |
| Immigrants | Immigrants | 6.3 /100 | #235 | Tragic 2.5% |
| Cajuns | 6.1 /100 | #236 | Tragic 2.5% |
| Sierra Leoneans | 5.9 /100 | #237 | Tragic 2.5% |
| Immigrants | Sierra Leone | 5.8 /100 | #238 | Tragic 2.5% |
Demographics Similar to Chinese by Single Father Households
In terms of single father households, the demographic groups most similar to Chinese are Israeli (2.0%, a difference of 0.040%), Cambodian (2.0%, a difference of 0.070%), Bulgarian (2.0%, a difference of 0.090%), Immigrants from Japan (2.0%, a difference of 0.18%), and Turkish (2.0%, a difference of 0.21%).
| Demographics | Rating | Rank | Single Father Households |
| Eastern Europeans | 100.0 /100 | #25 | Exceptional 2.0% |
| Assyrians/Chaldeans/Syriacs | 100.0 /100 | #26 | Exceptional 2.0% |
| Immigrants | South Central Asia | 100.0 /100 | #27 | Exceptional 2.0% |
| Immigrants | Japan | 100.0 /100 | #28 | Exceptional 2.0% |
| Bulgarians | 100.0 /100 | #29 | Exceptional 2.0% |
| Cambodians | 100.0 /100 | #30 | Exceptional 2.0% |
| Israelis | 100.0 /100 | #31 | Exceptional 2.0% |
| Chinese | 100.0 /100 | #32 | Exceptional 2.0% |
| Turks | 100.0 /100 | #33 | Exceptional 2.0% |
| Immigrants | Australia | 100.0 /100 | #34 | Exceptional 2.0% |
| Albanians | 100.0 /100 | #35 | Exceptional 2.0% |
| Immigrants | Belgium | 100.0 /100 | #36 | Exceptional 2.0% |
| Immigrants | St. Vincent and the Grenadines | 100.0 /100 | #37 | Exceptional 2.0% |
| Immigrants | Eastern Europe | 100.0 /100 | #38 | Exceptional 2.0% |
| Immigrants | Sri Lanka | 100.0 /100 | #39 | Exceptional 2.0% |