Finnish vs Chinese Single Father Households
COMPARE
Finnish
Chinese
Single Father Households
Single Father Households Comparison
Finns
Chinese
2.4%
SINGLE FATHER HOUSEHOLDS
18.3/ 100
METRIC RATING
212th/ 347
METRIC RANK
2.0%
SINGLE FATHER HOUSEHOLDS
100.0/ 100
METRIC RATING
32nd/ 347
METRIC RANK
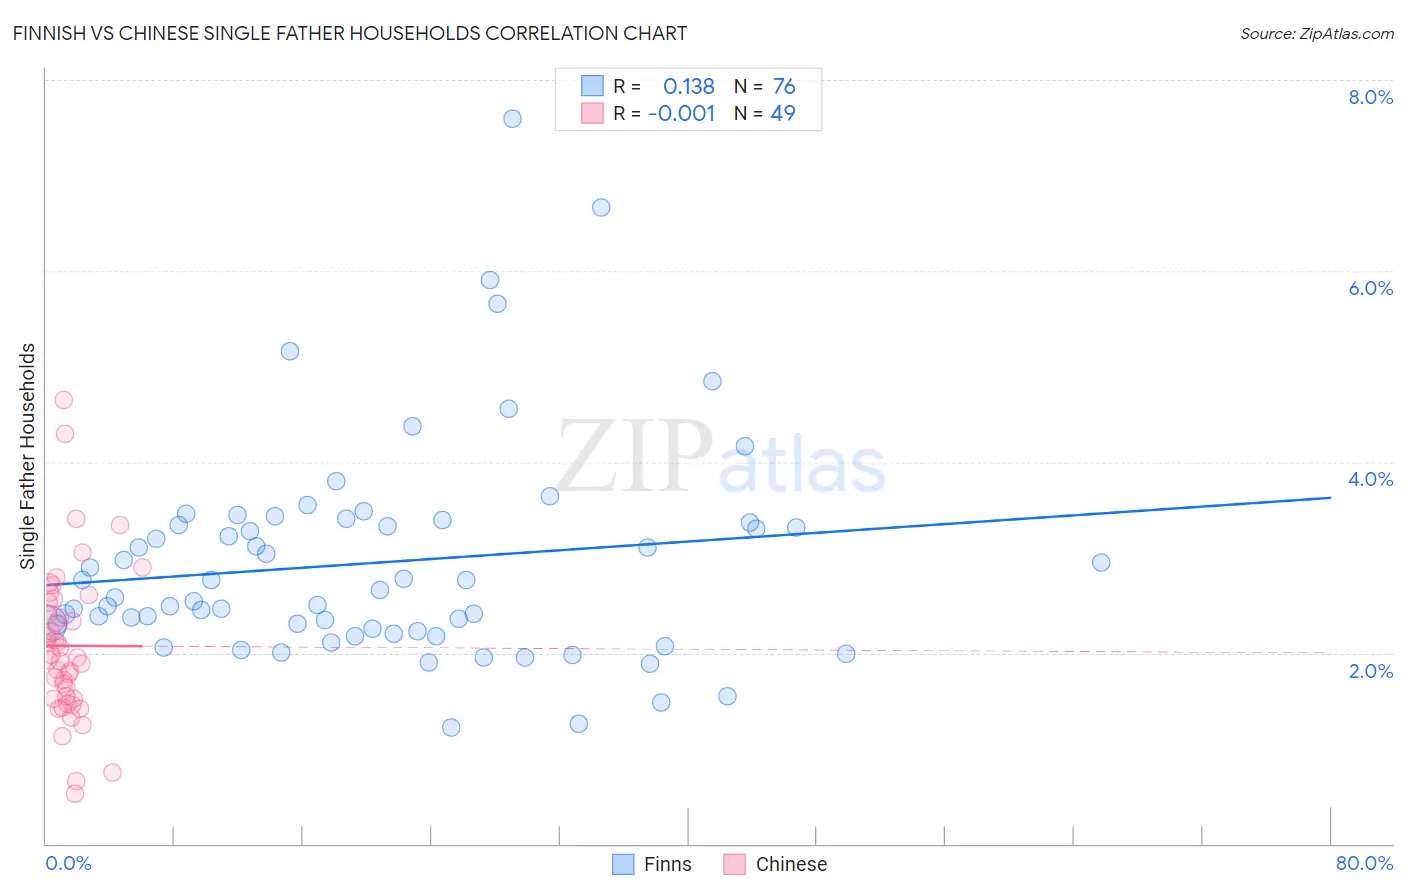
Finnish vs Chinese Single Father Households Correlation Chart
The statistical analysis conducted on geographies consisting of 400,074,189 people shows a poor positive correlation between the proportion of Finns and percentage of single father households in the United States with a correlation coefficient (R) of 0.138 and weighted average of 2.4%. Similarly, the statistical analysis conducted on geographies consisting of 64,726,791 people shows no correlation between the proportion of Chinese and percentage of single father households in the United States with a correlation coefficient (R) of -0.001 and weighted average of 2.0%, a difference of 21.8%.
Single Father Households Correlation Summary
| Measurement | Finnish | Chinese |
| Minimum | 1.2% | 0.52% |
| Maximum | 7.6% | 4.6% |
| Range | 6.4% | 4.1% |
| Mean | 2.9% | 2.1% |
| Median | 2.6% | 2.0% |
| Interquartile 25% (IQ1) | 2.2% | 1.5% |
| Interquartile 75% (IQ3) | 3.4% | 2.6% |
| Interquartile Range (IQR) | 1.1% | 1.0% |
| Standard Deviation (Sample) | 1.1% | 0.81% |
| Standard Deviation (Population) | 1.1% | 0.80% |
Similar Demographics by Single Father Households
Demographics Similar to Finns by Single Father Households
In terms of single father households, the demographic groups most similar to Finns are Immigrants from Nigeria (2.4%, a difference of 0.050%), Immigrants from Costa Rica (2.4%, a difference of 0.10%), Immigrants from Peru (2.4%, a difference of 0.11%), Norwegian (2.4%, a difference of 0.15%), and Ethiopian (2.4%, a difference of 0.21%).
| Demographics | Rating | Rank | Single Father Households |
| Immigrants | Afghanistan | 24.2 /100 | #205 | Fair 2.4% |
| Koreans | 24.1 /100 | #206 | Fair 2.4% |
| Whites/Caucasians | 22.6 /100 | #207 | Fair 2.4% |
| Immigrants | Kenya | 20.3 /100 | #208 | Fair 2.4% |
| Immigrants | Peru | 19.3 /100 | #209 | Poor 2.4% |
| Immigrants | Costa Rica | 19.2 /100 | #210 | Poor 2.4% |
| Immigrants | Nigeria | 18.7 /100 | #211 | Poor 2.4% |
| Finns | 18.3 /100 | #212 | Poor 2.4% |
| Norwegians | 17.1 /100 | #213 | Poor 2.4% |
| Ethiopians | 16.6 /100 | #214 | Poor 2.4% |
| Immigrants | South Eastern Asia | 15.9 /100 | #215 | Poor 2.4% |
| Immigrants | Ecuador | 14.9 /100 | #216 | Poor 2.4% |
| Dutch | 14.3 /100 | #217 | Poor 2.4% |
| Immigrants | Ethiopia | 13.4 /100 | #218 | Poor 2.4% |
| Sudanese | 13.0 /100 | #219 | Poor 2.4% |
Demographics Similar to Chinese by Single Father Households
In terms of single father households, the demographic groups most similar to Chinese are Israeli (2.0%, a difference of 0.040%), Cambodian (2.0%, a difference of 0.070%), Bulgarian (2.0%, a difference of 0.090%), Immigrants from Japan (2.0%, a difference of 0.18%), and Turkish (2.0%, a difference of 0.21%).
| Demographics | Rating | Rank | Single Father Households |
| Eastern Europeans | 100.0 /100 | #25 | Exceptional 2.0% |
| Assyrians/Chaldeans/Syriacs | 100.0 /100 | #26 | Exceptional 2.0% |
| Immigrants | South Central Asia | 100.0 /100 | #27 | Exceptional 2.0% |
| Immigrants | Japan | 100.0 /100 | #28 | Exceptional 2.0% |
| Bulgarians | 100.0 /100 | #29 | Exceptional 2.0% |
| Cambodians | 100.0 /100 | #30 | Exceptional 2.0% |
| Israelis | 100.0 /100 | #31 | Exceptional 2.0% |
| Chinese | 100.0 /100 | #32 | Exceptional 2.0% |
| Turks | 100.0 /100 | #33 | Exceptional 2.0% |
| Immigrants | Australia | 100.0 /100 | #34 | Exceptional 2.0% |
| Albanians | 100.0 /100 | #35 | Exceptional 2.0% |
| Immigrants | Belgium | 100.0 /100 | #36 | Exceptional 2.0% |
| Immigrants | St. Vincent and the Grenadines | 100.0 /100 | #37 | Exceptional 2.0% |
| Immigrants | Eastern Europe | 100.0 /100 | #38 | Exceptional 2.0% |
| Immigrants | Sri Lanka | 100.0 /100 | #39 | Exceptional 2.0% |