Venezuelan vs Celtic Average Family Size
COMPARE
Venezuelan
Celtic
Average Family Size
Average Family Size Comparison
Venezuelans
Celtics
3.25
AVERAGE FAMILY SIZE
81.4/ 100
METRIC RATING
141st/ 347
METRIC RANK
3.11
AVERAGE FAMILY SIZE
0.0/ 100
METRIC RATING
324th/ 347
METRIC RANK
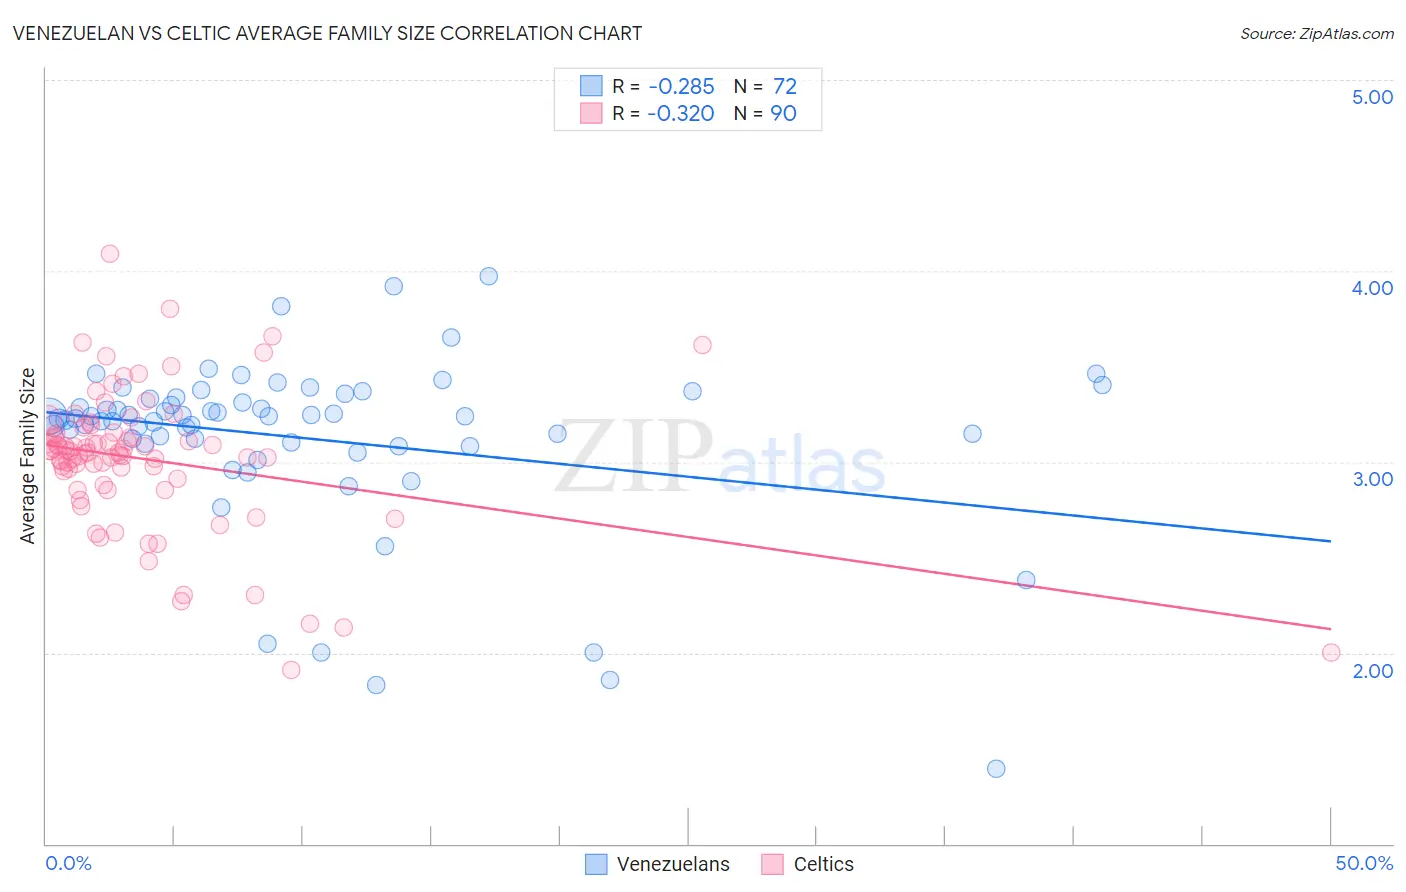
Venezuelan vs Celtic Average Family Size Correlation Chart
The statistical analysis conducted on geographies consisting of 306,140,333 people shows a weak negative correlation between the proportion of Venezuelans and average family size in the United States with a correlation coefficient (R) of -0.285 and weighted average of 3.25. Similarly, the statistical analysis conducted on geographies consisting of 168,846,519 people shows a mild negative correlation between the proportion of Celtics and average family size in the United States with a correlation coefficient (R) of -0.320 and weighted average of 3.11, a difference of 4.4%.
Average Family Size Correlation Summary
| Measurement | Venezuelan | Celtic |
| Minimum | 1.39 | 1.91 |
| Maximum | 3.97 | 4.09 |
| Range | 2.58 | 2.18 |
| Mean | 3.12 | 3.01 |
| Median | 3.23 | 3.05 |
| Interquartile 25% (IQ1) | 3.10 | 2.91 |
| Interquartile 75% (IQ3) | 3.33 | 3.15 |
| Interquartile Range (IQR) | 0.24 | 0.24 |
| Standard Deviation (Sample) | 0.46 | 0.37 |
| Standard Deviation (Population) | 0.45 | 0.37 |
Similar Demographics by Average Family Size
Demographics Similar to Venezuelans by Average Family Size
In terms of average family size, the demographic groups most similar to Venezuelans are Subsaharan African (3.25, a difference of 0.0%), Cuban (3.25, a difference of 0.010%), Immigrants from Ethiopia (3.25, a difference of 0.010%), Liberian (3.25, a difference of 0.010%), and Bhutanese (3.25, a difference of 0.010%).
| Demographics | Rating | Rank | Average Family Size |
| Africans | 84.9 /100 | #134 | Excellent 3.25 |
| Panamanians | 84.2 /100 | #135 | Excellent 3.25 |
| Comanche | 82.8 /100 | #136 | Excellent 3.25 |
| Immigrants | Middle Africa | 82.4 /100 | #137 | Excellent 3.25 |
| Cubans | 81.8 /100 | #138 | Excellent 3.25 |
| Immigrants | Ethiopia | 81.6 /100 | #139 | Excellent 3.25 |
| Sub-Saharan Africans | 81.6 /100 | #140 | Excellent 3.25 |
| Venezuelans | 81.4 /100 | #141 | Excellent 3.25 |
| Liberians | 81.2 /100 | #142 | Excellent 3.25 |
| Bhutanese | 81.0 /100 | #143 | Excellent 3.25 |
| Tsimshian | 80.2 /100 | #144 | Excellent 3.25 |
| Armenians | 78.2 /100 | #145 | Good 3.25 |
| Immigrants | Africa | 77.9 /100 | #146 | Good 3.25 |
| Immigrants | Jordan | 75.7 /100 | #147 | Good 3.24 |
| Blackfeet | 75.0 /100 | #148 | Good 3.24 |
Demographics Similar to Celtics by Average Family Size
In terms of average family size, the demographic groups most similar to Celtics are English (3.11, a difference of 0.040%), Soviet Union (3.11, a difference of 0.080%), Ottawa (3.11, a difference of 0.090%), Dutch (3.11, a difference of 0.10%), and Czech (3.11, a difference of 0.10%).
| Demographics | Rating | Rank | Average Family Size |
| Italians | 0.1 /100 | #317 | Tragic 3.12 |
| Eastern Europeans | 0.1 /100 | #318 | Tragic 3.12 |
| Welsh | 0.1 /100 | #319 | Tragic 3.12 |
| Immigrants | North America | 0.0 /100 | #320 | Tragic 3.12 |
| Immigrants | Austria | 0.0 /100 | #321 | Tragic 3.12 |
| Immigrants | Canada | 0.0 /100 | #322 | Tragic 3.12 |
| Soviet Union | 0.0 /100 | #323 | Tragic 3.11 |
| Celtics | 0.0 /100 | #324 | Tragic 3.11 |
| English | 0.0 /100 | #325 | Tragic 3.11 |
| Ottawa | 0.0 /100 | #326 | Tragic 3.11 |
| Dutch | 0.0 /100 | #327 | Tragic 3.11 |
| Czechs | 0.0 /100 | #328 | Tragic 3.11 |
| Belgians | 0.0 /100 | #329 | Tragic 3.11 |
| Latvians | 0.0 /100 | #330 | Tragic 3.11 |
| Scotch-Irish | 0.0 /100 | #331 | Tragic 3.11 |