African vs New Zealander Average Family Size
COMPARE
African
New Zealander
Average Family Size
Average Family Size Comparison
Africans
New Zealanders
3.25
AVERAGE FAMILY SIZE
84.9/ 100
METRIC RATING
134th/ 347
METRIC RANK
3.15
AVERAGE FAMILY SIZE
0.6/ 100
METRIC RATING
273rd/ 347
METRIC RANK
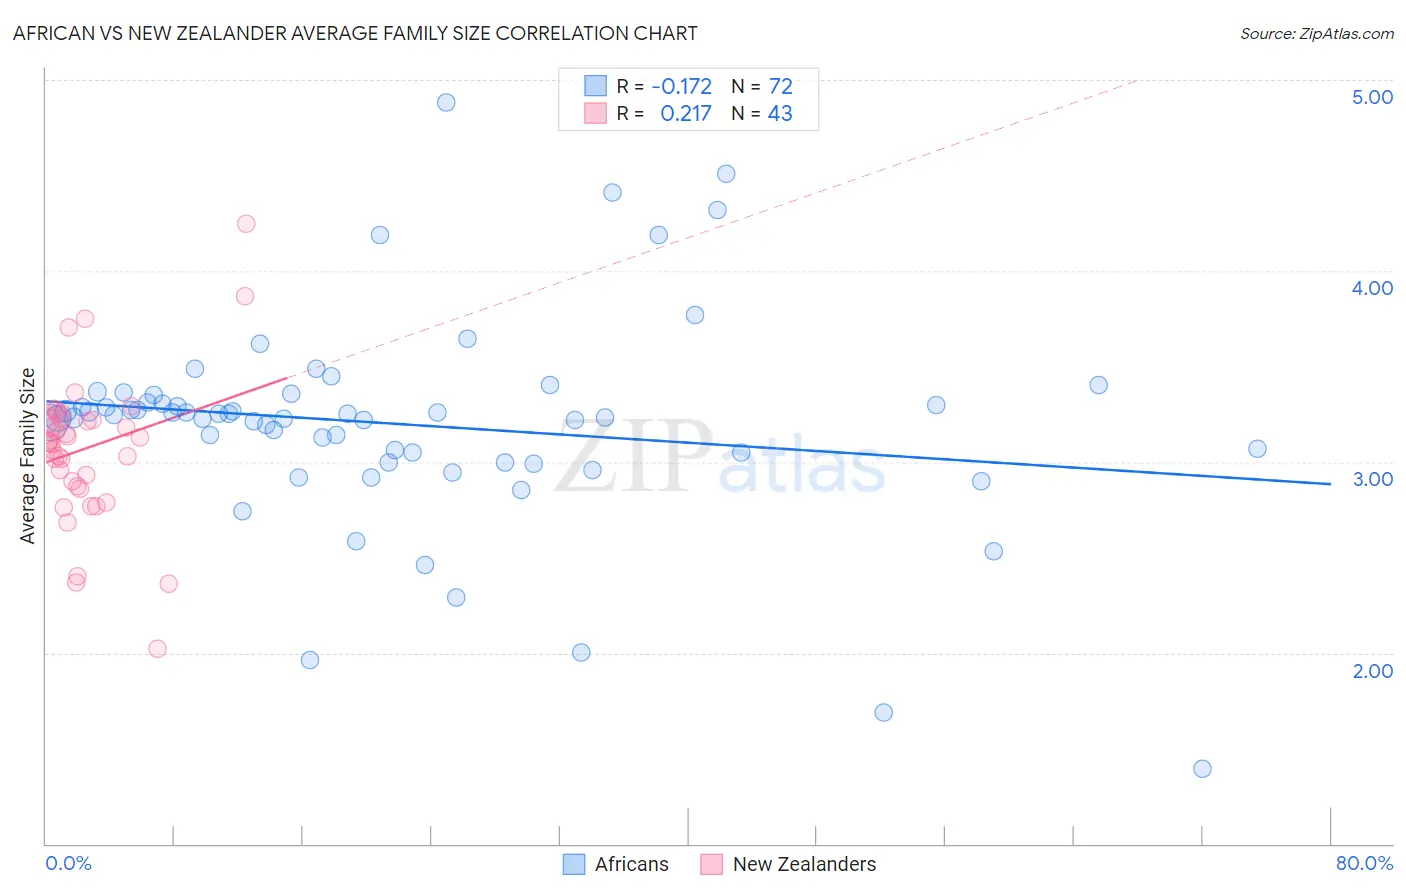
African vs New Zealander Average Family Size Correlation Chart
The statistical analysis conducted on geographies consisting of 469,598,302 people shows a poor negative correlation between the proportion of Africans and average family size in the United States with a correlation coefficient (R) of -0.172 and weighted average of 3.25. Similarly, the statistical analysis conducted on geographies consisting of 106,893,950 people shows a weak positive correlation between the proportion of New Zealanders and average family size in the United States with a correlation coefficient (R) of 0.217 and weighted average of 3.15, a difference of 3.2%.
Average Family Size Correlation Summary
| Measurement | African | New Zealander |
| Minimum | 1.39 | 2.02 |
| Maximum | 4.88 | 4.25 |
| Range | 3.49 | 2.23 |
| Mean | 3.20 | 3.07 |
| Median | 3.24 | 3.11 |
| Interquartile 25% (IQ1) | 3.02 | 2.87 |
| Interquartile 75% (IQ3) | 3.33 | 3.22 |
| Interquartile Range (IQR) | 0.31 | 0.35 |
| Standard Deviation (Sample) | 0.56 | 0.39 |
| Standard Deviation (Population) | 0.55 | 0.39 |
Similar Demographics by Average Family Size
Demographics Similar to Africans by Average Family Size
In terms of average family size, the demographic groups most similar to Africans are Panamanian (3.25, a difference of 0.020%), Immigrants from Venezuela (3.26, a difference of 0.050%), Costa Rican (3.26, a difference of 0.070%), Comanche (3.25, a difference of 0.070%), and Immigrants from Middle Africa (3.25, a difference of 0.080%).
| Demographics | Rating | Rank | Average Family Size |
| Immigrants | Syria | 90.6 /100 | #127 | Exceptional 3.26 |
| Colombians | 89.9 /100 | #128 | Excellent 3.26 |
| Immigrants | Hong Kong | 88.6 /100 | #129 | Excellent 3.26 |
| Laotians | 88.5 /100 | #130 | Excellent 3.26 |
| Immigrants | Western Asia | 87.7 /100 | #131 | Excellent 3.26 |
| Costa Ricans | 86.8 /100 | #132 | Excellent 3.26 |
| Immigrants | Venezuela | 86.3 /100 | #133 | Excellent 3.26 |
| Africans | 84.9 /100 | #134 | Excellent 3.25 |
| Panamanians | 84.2 /100 | #135 | Excellent 3.25 |
| Comanche | 82.8 /100 | #136 | Excellent 3.25 |
| Immigrants | Middle Africa | 82.4 /100 | #137 | Excellent 3.25 |
| Cubans | 81.8 /100 | #138 | Excellent 3.25 |
| Immigrants | Ethiopia | 81.6 /100 | #139 | Excellent 3.25 |
| Sub-Saharan Africans | 81.6 /100 | #140 | Excellent 3.25 |
| Venezuelans | 81.4 /100 | #141 | Excellent 3.25 |
Demographics Similar to New Zealanders by Average Family Size
In terms of average family size, the demographic groups most similar to New Zealanders are Immigrants from Belgium (3.15, a difference of 0.0%), Immigrants from Lithuania (3.15, a difference of 0.010%), Cambodian (3.15, a difference of 0.010%), Immigrants from Germany (3.15, a difference of 0.030%), and Tlingit-Haida (3.16, a difference of 0.060%).
| Demographics | Rating | Rank | Average Family Size |
| Immigrants | Greece | 0.9 /100 | #266 | Tragic 3.16 |
| Iroquois | 0.8 /100 | #267 | Tragic 3.16 |
| Maltese | 0.8 /100 | #268 | Tragic 3.16 |
| Immigrants | Singapore | 0.7 /100 | #269 | Tragic 3.16 |
| Tlingit-Haida | 0.7 /100 | #270 | Tragic 3.16 |
| Immigrants | Germany | 0.7 /100 | #271 | Tragic 3.15 |
| Immigrants | Lithuania | 0.6 /100 | #272 | Tragic 3.15 |
| New Zealanders | 0.6 /100 | #273 | Tragic 3.15 |
| Immigrants | Belgium | 0.6 /100 | #274 | Tragic 3.15 |
| Cambodians | 0.6 /100 | #275 | Tragic 3.15 |
| Immigrants | Bosnia and Herzegovina | 0.5 /100 | #276 | Tragic 3.15 |
| Swiss | 0.5 /100 | #277 | Tragic 3.15 |
| Okinawans | 0.5 /100 | #278 | Tragic 3.15 |
| Immigrants | Europe | 0.5 /100 | #279 | Tragic 3.15 |
| Immigrants | England | 0.4 /100 | #280 | Tragic 3.15 |