African vs Costa Rican Family Households
COMPARE
African
Costa Rican
Family Households
Family Households Comparison
Africans
Costa Ricans
62.1%
FAMILY HOUSEHOLDS
0.0/ 100
METRIC RATING
306th/ 347
METRIC RANK
65.9%
FAMILY HOUSEHOLDS
99.9/ 100
METRIC RATING
65th/ 347
METRIC RANK
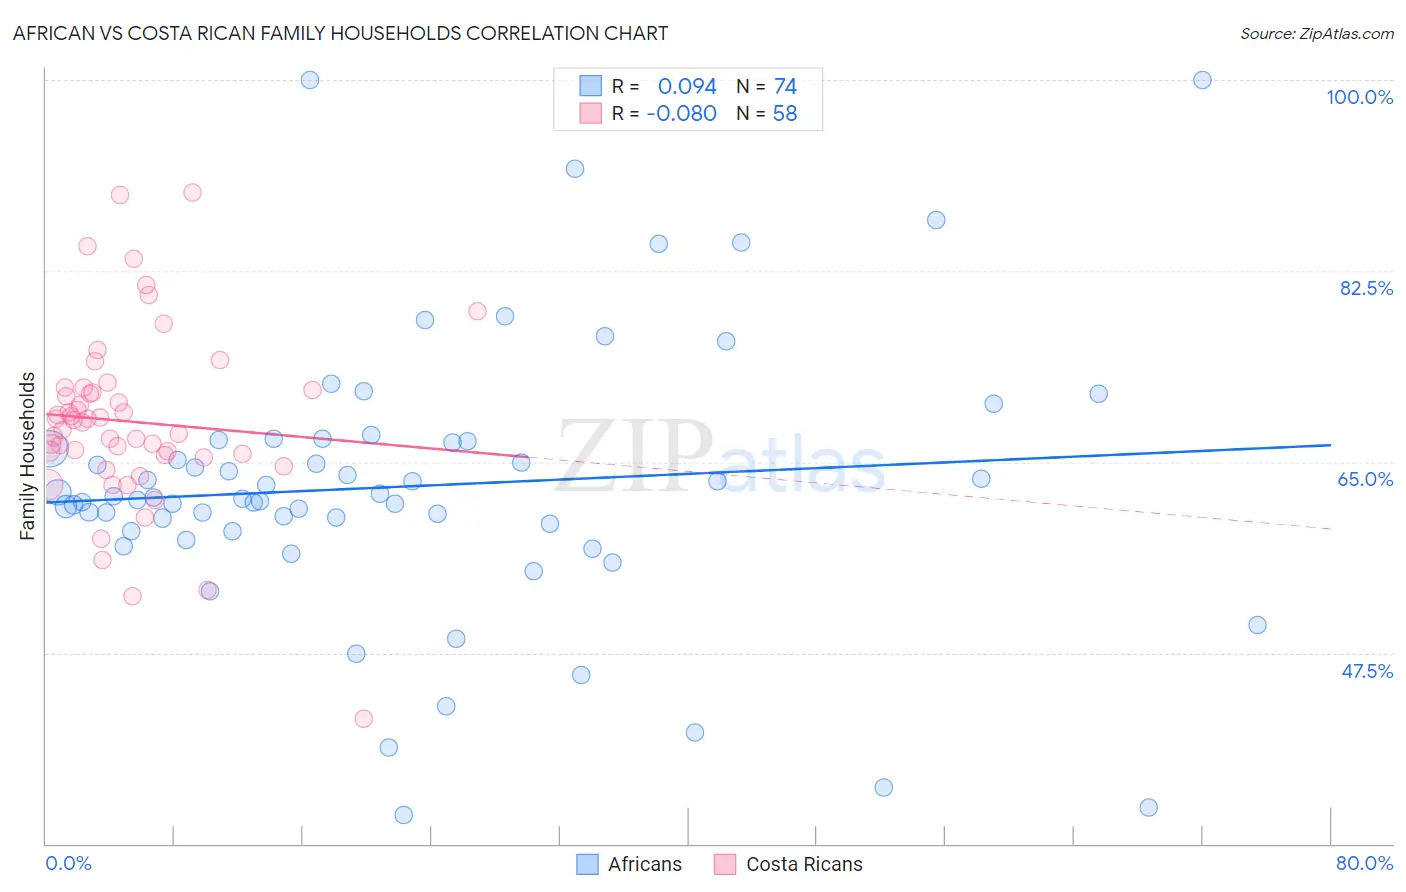
African vs Costa Rican Family Households Correlation Chart
The statistical analysis conducted on geographies consisting of 469,598,671 people shows a slight positive correlation between the proportion of Africans and percentage of family households in the United States with a correlation coefficient (R) of 0.094 and weighted average of 62.1%. Similarly, the statistical analysis conducted on geographies consisting of 253,469,677 people shows a slight negative correlation between the proportion of Costa Ricans and percentage of family households in the United States with a correlation coefficient (R) of -0.080 and weighted average of 65.9%, a difference of 6.1%.
Family Households Correlation Summary
| Measurement | African | Costa Rican |
| Minimum | 32.6% | 41.4% |
| Maximum | 100.0% | 89.7% |
| Range | 67.4% | 48.2% |
| Mean | 62.8% | 68.7% |
| Median | 61.7% | 68.7% |
| Interquartile 25% (IQ1) | 58.7% | 65.6% |
| Interquartile 75% (IQ3) | 66.9% | 71.6% |
| Interquartile Range (IQR) | 8.2% | 6.0% |
| Standard Deviation (Sample) | 12.7% | 8.2% |
| Standard Deviation (Population) | 12.7% | 8.2% |
Similar Demographics by Family Households
Demographics Similar to Africans by Family Households
In terms of family households, the demographic groups most similar to Africans are Bermudan (62.2%, a difference of 0.020%), Immigrants from Norway (62.1%, a difference of 0.080%), Chippewa (62.1%, a difference of 0.080%), Subsaharan African (62.1%, a difference of 0.14%), and Iroquois (62.2%, a difference of 0.17%).
| Demographics | Rating | Rank | Family Households |
| Immigrants | Kuwait | 0.0 /100 | #299 | Tragic 62.4% |
| Immigrants | Africa | 0.0 /100 | #300 | Tragic 62.4% |
| Immigrants | Albania | 0.0 /100 | #301 | Tragic 62.4% |
| Immigrants | Kenya | 0.0 /100 | #302 | Tragic 62.3% |
| Cree | 0.0 /100 | #303 | Tragic 62.3% |
| Iroquois | 0.0 /100 | #304 | Tragic 62.2% |
| Bermudans | 0.0 /100 | #305 | Tragic 62.2% |
| Africans | 0.0 /100 | #306 | Tragic 62.1% |
| Immigrants | Norway | 0.0 /100 | #307 | Tragic 62.1% |
| Chippewa | 0.0 /100 | #308 | Tragic 62.1% |
| Sub-Saharan Africans | 0.0 /100 | #309 | Tragic 62.1% |
| Immigrants | Liberia | 0.0 /100 | #310 | Tragic 62.0% |
| Immigrants | Morocco | 0.0 /100 | #311 | Tragic 62.0% |
| Immigrants | Latvia | 0.0 /100 | #312 | Tragic 62.0% |
| Liberians | 0.0 /100 | #313 | Tragic 62.0% |
Demographics Similar to Costa Ricans by Family Households
In terms of family households, the demographic groups most similar to Costa Ricans are Pima (65.9%, a difference of 0.010%), Fijian (65.9%, a difference of 0.040%), Filipino (65.9%, a difference of 0.040%), Japanese (65.9%, a difference of 0.060%), and Immigrants from Indonesia (66.0%, a difference of 0.070%).
| Demographics | Rating | Rank | Family Households |
| Immigrants | Asia | 100.0 /100 | #58 | Exceptional 66.1% |
| Immigrants | Korea | 100.0 /100 | #59 | Exceptional 66.0% |
| South Americans | 100.0 /100 | #60 | Exceptional 66.0% |
| Danes | 100.0 /100 | #61 | Exceptional 66.0% |
| Central Americans | 100.0 /100 | #62 | Exceptional 66.0% |
| Immigrants | Indonesia | 100.0 /100 | #63 | Exceptional 66.0% |
| Pima | 99.9 /100 | #64 | Exceptional 65.9% |
| Costa Ricans | 99.9 /100 | #65 | Exceptional 65.9% |
| Fijians | 99.9 /100 | #66 | Exceptional 65.9% |
| Filipinos | 99.9 /100 | #67 | Exceptional 65.9% |
| Japanese | 99.9 /100 | #68 | Exceptional 65.9% |
| Malaysians | 99.9 /100 | #69 | Exceptional 65.9% |
| Immigrants | Afghanistan | 99.9 /100 | #70 | Exceptional 65.9% |
| Bhutanese | 99.9 /100 | #71 | Exceptional 65.9% |
| Portuguese | 99.9 /100 | #72 | Exceptional 65.8% |