Zimbabwean vs Immigrants from Kazakhstan 9th Grade
COMPARE
Zimbabwean
Immigrants from Kazakhstan
9th Grade
9th Grade Comparison
Zimbabweans
Immigrants from Kazakhstan
95.9%
9TH GRADE
99.7/ 100
METRIC RATING
64th/ 347
METRIC RANK
95.1%
9TH GRADE
74.7/ 100
METRIC RATING
155th/ 347
METRIC RANK
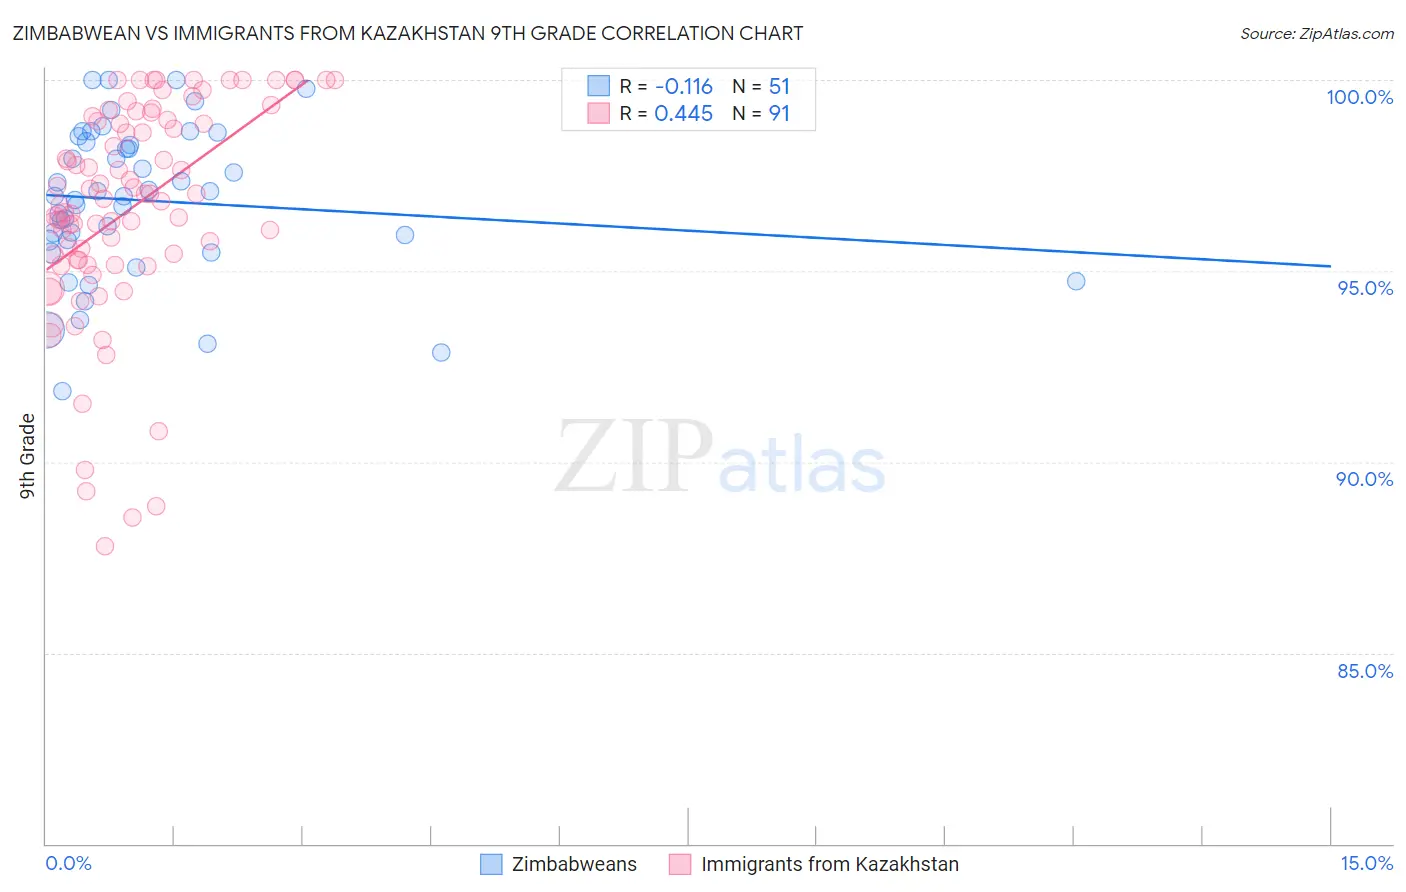
Zimbabwean vs Immigrants from Kazakhstan 9th Grade Correlation Chart
The statistical analysis conducted on geographies consisting of 69,203,423 people shows a poor negative correlation between the proportion of Zimbabweans and percentage of population with at least 9th grade education in the United States with a correlation coefficient (R) of -0.116 and weighted average of 95.9%. Similarly, the statistical analysis conducted on geographies consisting of 124,429,881 people shows a moderate positive correlation between the proportion of Immigrants from Kazakhstan and percentage of population with at least 9th grade education in the United States with a correlation coefficient (R) of 0.445 and weighted average of 95.1%, a difference of 0.84%.
9th Grade Correlation Summary
| Measurement | Zimbabwean | Immigrants from Kazakhstan |
| Minimum | 91.8% | 87.8% |
| Maximum | 100.0% | 100.0% |
| Range | 8.2% | 12.2% |
| Mean | 96.8% | 96.6% |
| Median | 97.0% | 96.9% |
| Interquartile 25% (IQ1) | 95.8% | 95.3% |
| Interquartile 75% (IQ3) | 98.4% | 98.9% |
| Interquartile Range (IQR) | 2.6% | 3.7% |
| Standard Deviation (Sample) | 2.0% | 2.8% |
| Standard Deviation (Population) | 1.9% | 2.8% |
Similar Demographics by 9th Grade
Demographics Similar to Zimbabweans by 9th Grade
In terms of 9th grade, the demographic groups most similar to Zimbabweans are Canadian (95.9%, a difference of 0.010%), Immigrants from England (95.9%, a difference of 0.010%), Immigrants from Netherlands (95.8%, a difference of 0.030%), Cypriot (95.8%, a difference of 0.030%), and Immigrants from Ireland (95.8%, a difference of 0.040%).
| Demographics | Rating | Rank | 9th Grade |
| Macedonians | 99.8 /100 | #57 | Exceptional 96.0% |
| Aleuts | 99.8 /100 | #58 | Exceptional 96.0% |
| New Zealanders | 99.8 /100 | #59 | Exceptional 95.9% |
| Native Hawaiians | 99.8 /100 | #60 | Exceptional 95.9% |
| Sioux | 99.8 /100 | #61 | Exceptional 95.9% |
| Ukrainians | 99.7 /100 | #62 | Exceptional 95.9% |
| Canadians | 99.7 /100 | #63 | Exceptional 95.9% |
| Zimbabweans | 99.7 /100 | #64 | Exceptional 95.9% |
| Immigrants | England | 99.6 /100 | #65 | Exceptional 95.9% |
| Immigrants | Netherlands | 99.6 /100 | #66 | Exceptional 95.8% |
| Cypriots | 99.6 /100 | #67 | Exceptional 95.8% |
| Immigrants | Ireland | 99.6 /100 | #68 | Exceptional 95.8% |
| Immigrants | Lithuania | 99.6 /100 | #69 | Exceptional 95.8% |
| Immigrants | Australia | 99.5 /100 | #70 | Exceptional 95.8% |
| Immigrants | Belgium | 99.5 /100 | #71 | Exceptional 95.8% |
Demographics Similar to Immigrants from Kazakhstan by 9th Grade
In terms of 9th grade, the demographic groups most similar to Immigrants from Kazakhstan are Arab (95.1%, a difference of 0.0%), Albanian (95.1%, a difference of 0.010%), Ugandan (95.1%, a difference of 0.020%), Immigrants from Kenya (95.0%, a difference of 0.020%), and Mongolian (95.0%, a difference of 0.020%).
| Demographics | Rating | Rank | 9th Grade |
| Immigrants | Jordan | 81.2 /100 | #148 | Excellent 95.1% |
| Immigrants | Korea | 79.6 /100 | #149 | Good 95.1% |
| Kenyans | 79.1 /100 | #150 | Good 95.1% |
| Cajuns | 77.3 /100 | #151 | Good 95.1% |
| Ugandans | 77.0 /100 | #152 | Good 95.1% |
| Albanians | 76.1 /100 | #153 | Good 95.1% |
| Arabs | 74.9 /100 | #154 | Good 95.1% |
| Immigrants | Kazakhstan | 74.7 /100 | #155 | Good 95.1% |
| Immigrants | Kenya | 73.1 /100 | #156 | Good 95.0% |
| Mongolians | 73.0 /100 | #157 | Good 95.0% |
| Egyptians | 70.1 /100 | #158 | Good 95.0% |
| Immigrants | Ukraine | 67.4 /100 | #159 | Good 95.0% |
| Immigrants | Italy | 66.6 /100 | #160 | Good 95.0% |
| French American Indians | 66.5 /100 | #161 | Good 95.0% |
| Bermudans | 65.8 /100 | #162 | Good 95.0% |