Zimbabwean vs Immigrants from Cambodia Unemployment Among Ages 35 to 44 years
COMPARE
Zimbabwean
Immigrants from Cambodia
Unemployment Among Ages 35 to 44 years
Unemployment Among Ages 35 to 44 years Comparison
Zimbabweans
Immigrants from Cambodia
4.3%
UNEMPLOYMENT AMONG AGES 35 TO 44 YEARS
98.8/ 100
METRIC RATING
40th/ 347
METRIC RANK
5.0%
UNEMPLOYMENT AMONG AGES 35 TO 44 YEARS
1.5/ 100
METRIC RATING
229th/ 347
METRIC RANK
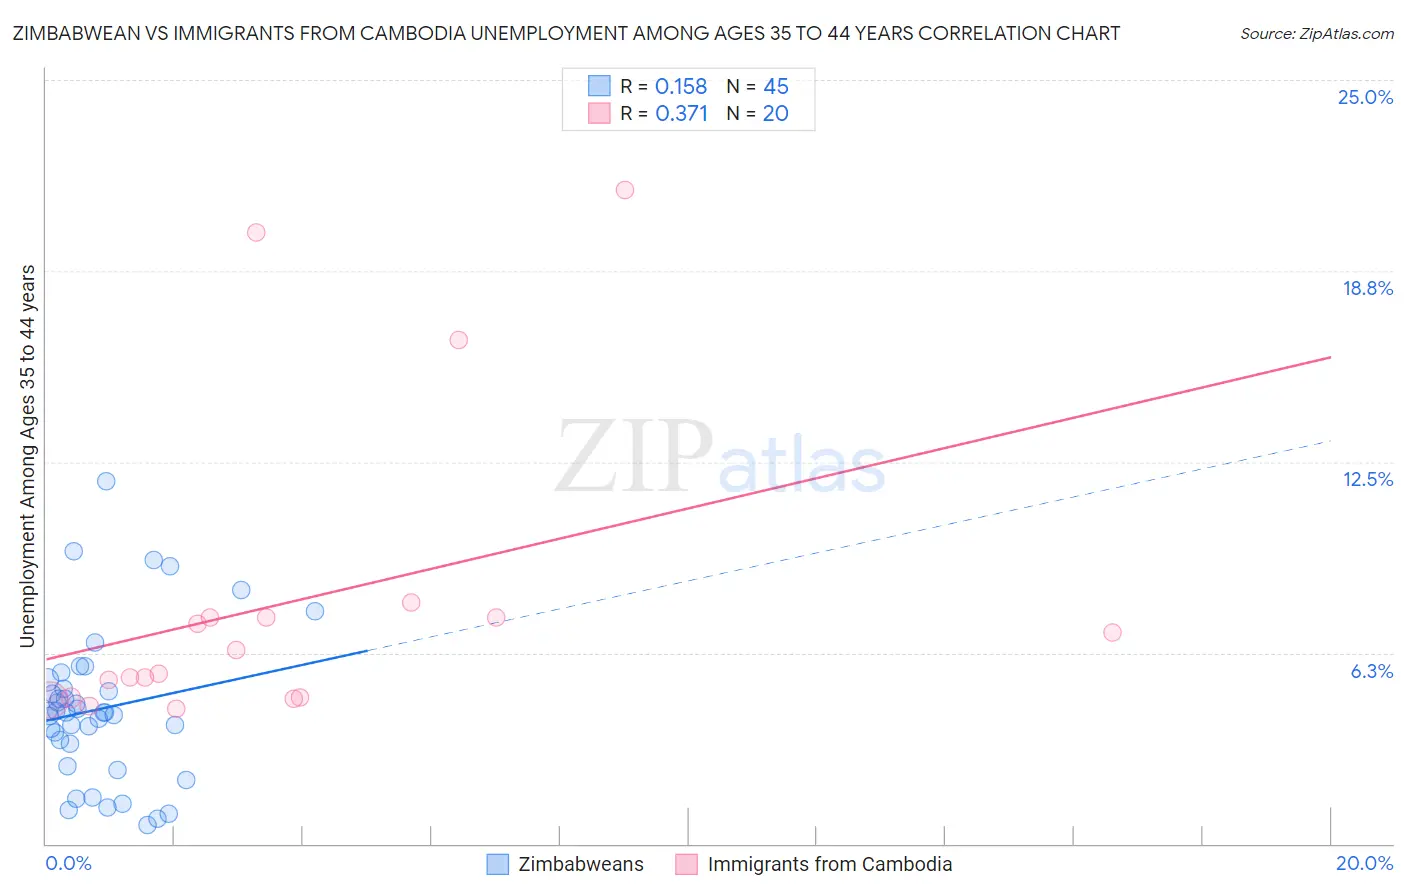
Zimbabwean vs Immigrants from Cambodia Unemployment Among Ages 35 to 44 years Correlation Chart
The statistical analysis conducted on geographies consisting of 68,932,734 people shows a poor positive correlation between the proportion of Zimbabweans and unemployment rate among population between the ages 35 and 44 in the United States with a correlation coefficient (R) of 0.158 and weighted average of 4.3%. Similarly, the statistical analysis conducted on geographies consisting of 203,499,658 people shows a mild positive correlation between the proportion of Immigrants from Cambodia and unemployment rate among population between the ages 35 and 44 in the United States with a correlation coefficient (R) of 0.371 and weighted average of 5.0%, a difference of 16.5%.
Unemployment Among Ages 35 to 44 years Correlation Summary
| Measurement | Zimbabwean | Immigrants from Cambodia |
| Minimum | 0.60% | 4.4% |
| Maximum | 11.9% | 21.4% |
| Range | 11.3% | 17.0% |
| Mean | 4.4% | 7.9% |
| Median | 4.3% | 6.0% |
| Interquartile 25% (IQ1) | 2.9% | 4.8% |
| Interquartile 75% (IQ3) | 5.2% | 7.4% |
| Interquartile Range (IQR) | 2.3% | 2.6% |
| Standard Deviation (Sample) | 2.5% | 5.1% |
| Standard Deviation (Population) | 2.4% | 5.0% |
Similar Demographics by Unemployment Among Ages 35 to 44 years
Demographics Similar to Zimbabweans by Unemployment Among Ages 35 to 44 years
In terms of unemployment among ages 35 to 44 years, the demographic groups most similar to Zimbabweans are Palestinian (4.3%, a difference of 0.060%), Belgian (4.3%, a difference of 0.10%), Burmese (4.3%, a difference of 0.11%), German (4.3%, a difference of 0.11%), and Immigrants from Zimbabwe (4.3%, a difference of 0.18%).
| Demographics | Rating | Rank | Unemployment Among Ages 35 to 44 years |
| Immigrants | Sri Lanka | 99.1 /100 | #33 | Exceptional 4.3% |
| Jordanians | 99.0 /100 | #34 | Exceptional 4.3% |
| Luxembourgers | 99.0 /100 | #35 | Exceptional 4.3% |
| Mongolians | 98.9 /100 | #36 | Exceptional 4.3% |
| Immigrants | Zimbabwe | 98.9 /100 | #37 | Exceptional 4.3% |
| Burmese | 98.9 /100 | #38 | Exceptional 4.3% |
| Palestinians | 98.8 /100 | #39 | Exceptional 4.3% |
| Zimbabweans | 98.8 /100 | #40 | Exceptional 4.3% |
| Belgians | 98.7 /100 | #41 | Exceptional 4.3% |
| Germans | 98.7 /100 | #42 | Exceptional 4.3% |
| Eastern Europeans | 98.7 /100 | #43 | Exceptional 4.3% |
| Immigrants | Malaysia | 98.7 /100 | #44 | Exceptional 4.3% |
| Immigrants | Korea | 98.4 /100 | #45 | Exceptional 4.3% |
| Immigrants | Belgium | 98.4 /100 | #46 | Exceptional 4.3% |
| British | 98.3 /100 | #47 | Exceptional 4.4% |
Demographics Similar to Immigrants from Cambodia by Unemployment Among Ages 35 to 44 years
In terms of unemployment among ages 35 to 44 years, the demographic groups most similar to Immigrants from Cambodia are Samoan (5.0%, a difference of 0.28%), Liberian (5.1%, a difference of 0.28%), Japanese (5.1%, a difference of 0.31%), Iroquois (5.1%, a difference of 0.39%), and Immigrants from Uzbekistan (5.0%, a difference of 0.43%).
| Demographics | Rating | Rank | Unemployment Among Ages 35 to 44 years |
| Hmong | 3.5 /100 | #222 | Tragic 5.0% |
| Immigrants | Panama | 3.3 /100 | #223 | Tragic 5.0% |
| Panamanians | 2.9 /100 | #224 | Tragic 5.0% |
| Immigrants | Lebanon | 2.7 /100 | #225 | Tragic 5.0% |
| Potawatomi | 2.5 /100 | #226 | Tragic 5.0% |
| Immigrants | Uzbekistan | 1.9 /100 | #227 | Tragic 5.0% |
| Samoans | 1.8 /100 | #228 | Tragic 5.0% |
| Immigrants | Cambodia | 1.5 /100 | #229 | Tragic 5.0% |
| Liberians | 1.3 /100 | #230 | Tragic 5.1% |
| Japanese | 1.2 /100 | #231 | Tragic 5.1% |
| Iroquois | 1.2 /100 | #232 | Tragic 5.1% |
| Immigrants | Nigeria | 1.2 /100 | #233 | Tragic 5.1% |
| Portuguese | 1.1 /100 | #234 | Tragic 5.1% |
| Guamanians/Chamorros | 0.9 /100 | #235 | Tragic 5.1% |
| Central Americans | 0.8 /100 | #236 | Tragic 5.1% |