Welsh vs Immigrants from Zimbabwe 11th Grade
COMPARE
Welsh
Immigrants from Zimbabwe
11th Grade
11th Grade Comparison
Welsh
Immigrants from Zimbabwe
94.2%
11TH GRADE
99.9/ 100
METRIC RATING
31st/ 347
METRIC RANK
93.4%
11TH GRADE
97.8/ 100
METRIC RATING
113th/ 347
METRIC RANK
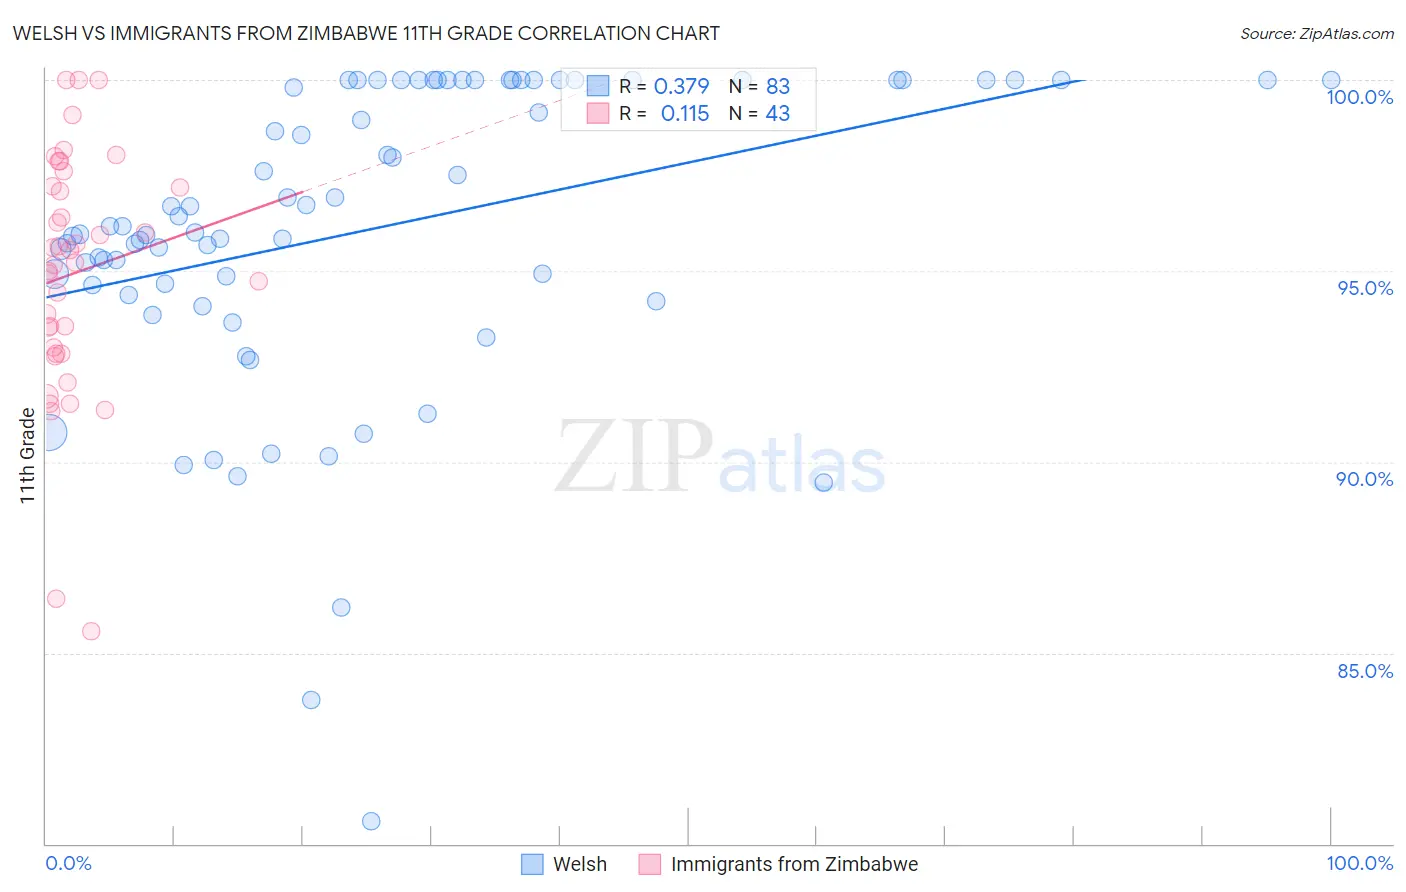
Welsh vs Immigrants from Zimbabwe 11th Grade Correlation Chart
The statistical analysis conducted on geographies consisting of 528,596,196 people shows a mild positive correlation between the proportion of Welsh and percentage of population with at least 11th grade education in the United States with a correlation coefficient (R) of 0.379 and weighted average of 94.2%. Similarly, the statistical analysis conducted on geographies consisting of 117,809,656 people shows a poor positive correlation between the proportion of Immigrants from Zimbabwe and percentage of population with at least 11th grade education in the United States with a correlation coefficient (R) of 0.115 and weighted average of 93.4%, a difference of 0.92%.
11th Grade Correlation Summary
| Measurement | Welsh | Immigrants from Zimbabwe |
| Minimum | 80.6% | 85.5% |
| Maximum | 100.0% | 100.0% |
| Range | 19.4% | 14.5% |
| Mean | 96.1% | 94.9% |
| Median | 96.2% | 95.2% |
| Interquartile 25% (IQ1) | 94.6% | 92.8% |
| Interquartile 75% (IQ3) | 100.0% | 97.2% |
| Interquartile Range (IQR) | 5.4% | 4.4% |
| Standard Deviation (Sample) | 4.0% | 3.2% |
| Standard Deviation (Population) | 4.0% | 3.1% |
Similar Demographics by 11th Grade
Demographics Similar to Welsh by 11th Grade
In terms of 11th grade, the demographic groups most similar to Welsh are Belgian (94.2%, a difference of 0.0%), Russian (94.3%, a difference of 0.020%), British (94.2%, a difference of 0.040%), Immigrants from Scotland (94.2%, a difference of 0.040%), and Immigrants from Singapore (94.2%, a difference of 0.050%).
| Demographics | Rating | Rank | 11th Grade |
| English | 100.0 /100 | #24 | Exceptional 94.4% |
| Irish | 100.0 /100 | #25 | Exceptional 94.4% |
| Scottish | 100.0 /100 | #26 | Exceptional 94.4% |
| Europeans | 100.0 /100 | #27 | Exceptional 94.4% |
| Estonians | 100.0 /100 | #28 | Exceptional 94.4% |
| Dutch | 100.0 /100 | #29 | Exceptional 94.3% |
| Russians | 100.0 /100 | #30 | Exceptional 94.3% |
| Welsh | 99.9 /100 | #31 | Exceptional 94.2% |
| Belgians | 99.9 /100 | #32 | Exceptional 94.2% |
| British | 99.9 /100 | #33 | Exceptional 94.2% |
| Immigrants | Scotland | 99.9 /100 | #34 | Exceptional 94.2% |
| Immigrants | Singapore | 99.9 /100 | #35 | Exceptional 94.2% |
| Immigrants | Northern Europe | 99.9 /100 | #36 | Exceptional 94.2% |
| Northern Europeans | 99.9 /100 | #37 | Exceptional 94.2% |
| Hungarians | 99.9 /100 | #38 | Exceptional 94.2% |
Demographics Similar to Immigrants from Zimbabwe by 11th Grade
In terms of 11th grade, the demographic groups most similar to Immigrants from Zimbabwe are Jordanian (93.4%, a difference of 0.0%), Palestinian (93.4%, a difference of 0.020%), Yugoslavian (93.4%, a difference of 0.030%), Immigrants from Germany (93.4%, a difference of 0.030%), and Immigrants from Hungary (93.4%, a difference of 0.030%).
| Demographics | Rating | Rank | 11th Grade |
| Immigrants | Croatia | 98.6 /100 | #106 | Exceptional 93.5% |
| Immigrants | Norway | 98.4 /100 | #107 | Exceptional 93.5% |
| Alaska Natives | 98.4 /100 | #108 | Exceptional 93.5% |
| Immigrants | Kuwait | 98.4 /100 | #109 | Exceptional 93.5% |
| Syrians | 98.4 /100 | #110 | Exceptional 93.4% |
| Yugoslavians | 98.1 /100 | #111 | Exceptional 93.4% |
| Immigrants | Germany | 98.0 /100 | #112 | Exceptional 93.4% |
| Immigrants | Zimbabwe | 97.8 /100 | #113 | Exceptional 93.4% |
| Jordanians | 97.8 /100 | #114 | Exceptional 93.4% |
| Palestinians | 97.7 /100 | #115 | Exceptional 93.4% |
| Immigrants | Hungary | 97.5 /100 | #116 | Exceptional 93.4% |
| Whites/Caucasians | 97.4 /100 | #117 | Exceptional 93.3% |
| Immigrants | Korea | 97.0 /100 | #118 | Exceptional 93.3% |
| Israelis | 97.0 /100 | #119 | Exceptional 93.3% |
| Immigrants | Russia | 96.6 /100 | #120 | Exceptional 93.3% |