Yugoslavian vs Immigrants from Zimbabwe 11th Grade
COMPARE
Yugoslavian
Immigrants from Zimbabwe
11th Grade
11th Grade Comparison
Yugoslavians
Immigrants from Zimbabwe
93.4%
11TH GRADE
98.1/ 100
METRIC RATING
111th/ 347
METRIC RANK
93.4%
11TH GRADE
97.8/ 100
METRIC RATING
113th/ 347
METRIC RANK
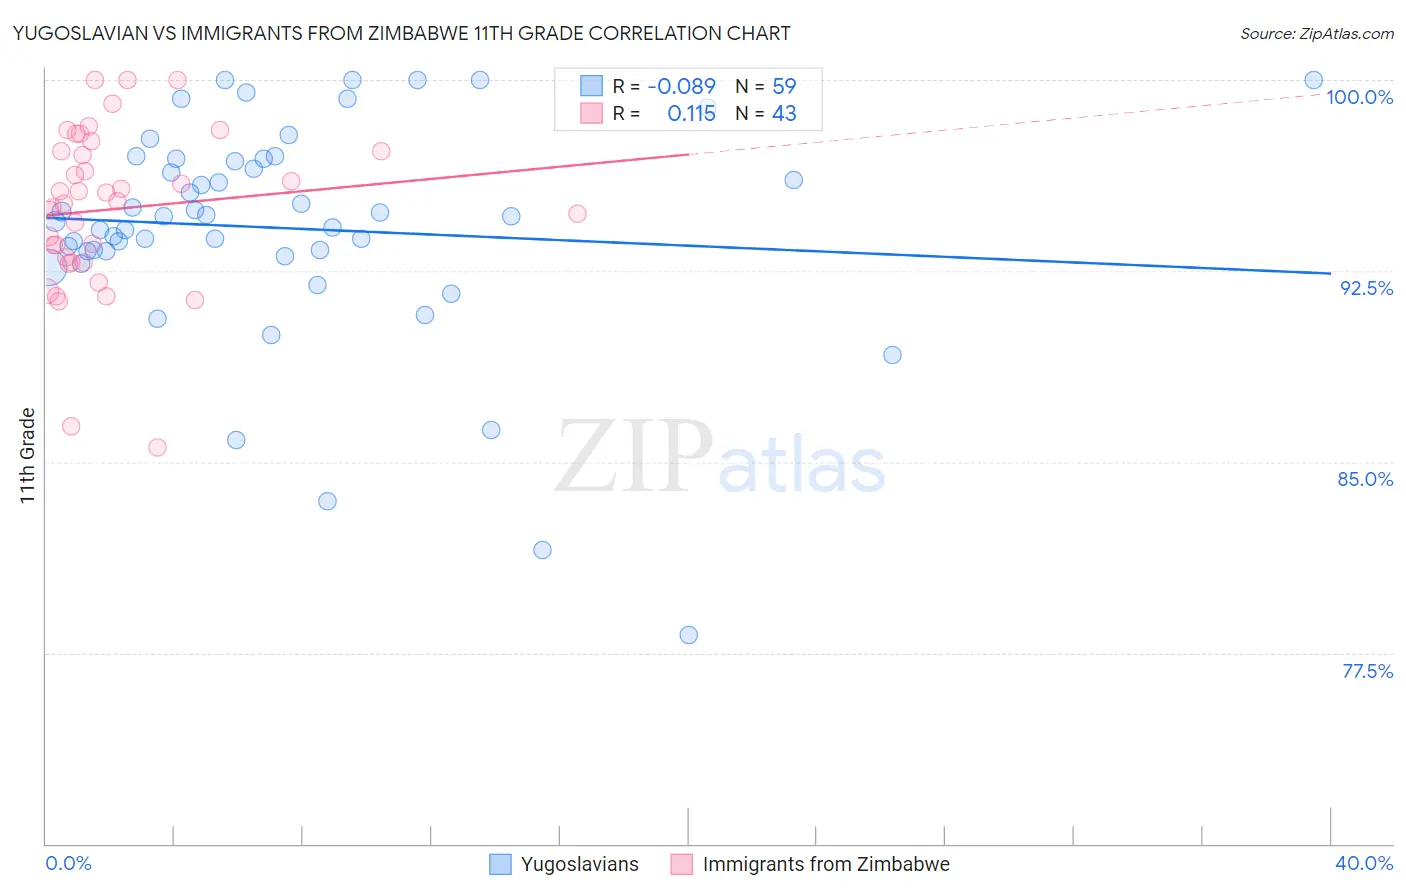
Yugoslavian vs Immigrants from Zimbabwe 11th Grade Correlation Chart
The statistical analysis conducted on geographies consisting of 285,719,638 people shows a slight negative correlation between the proportion of Yugoslavians and percentage of population with at least 11th grade education in the United States with a correlation coefficient (R) of -0.089 and weighted average of 93.4%. Similarly, the statistical analysis conducted on geographies consisting of 117,809,656 people shows a poor positive correlation between the proportion of Immigrants from Zimbabwe and percentage of population with at least 11th grade education in the United States with a correlation coefficient (R) of 0.115 and weighted average of 93.4%, a difference of 0.030%.
11th Grade Correlation Summary
| Measurement | Yugoslavian | Immigrants from Zimbabwe |
| Minimum | 78.2% | 85.5% |
| Maximum | 100.0% | 100.0% |
| Range | 21.8% | 14.5% |
| Mean | 94.2% | 94.9% |
| Median | 94.7% | 95.2% |
| Interquartile 25% (IQ1) | 93.3% | 92.8% |
| Interquartile 75% (IQ3) | 96.9% | 97.2% |
| Interquartile Range (IQR) | 3.7% | 4.4% |
| Standard Deviation (Sample) | 4.4% | 3.2% |
| Standard Deviation (Population) | 4.3% | 3.1% |
Demographics Similar to Yugoslavians and Immigrants from Zimbabwe by 11th Grade
In terms of 11th grade, the demographic groups most similar to Yugoslavians are Immigrants from Germany (93.4%, a difference of 0.010%), Syrian (93.4%, a difference of 0.040%), Jordanian (93.4%, a difference of 0.040%), Immigrants from Norway (93.5%, a difference of 0.050%), and Alaska Native (93.5%, a difference of 0.050%). Similarly, the demographic groups most similar to Immigrants from Zimbabwe are Jordanian (93.4%, a difference of 0.0%), Palestinian (93.4%, a difference of 0.020%), Immigrants from Germany (93.4%, a difference of 0.030%), Immigrants from Hungary (93.4%, a difference of 0.030%), and White/Caucasian (93.3%, a difference of 0.050%).
| Demographics | Rating | Rank | 11th Grade |
| Chippewa | 98.6 /100 | #102 | Exceptional 93.5% |
| Lebanese | 98.6 /100 | #103 | Exceptional 93.5% |
| Immigrants | Europe | 98.6 /100 | #104 | Exceptional 93.5% |
| Immigrants | Serbia | 98.6 /100 | #105 | Exceptional 93.5% |
| Immigrants | Croatia | 98.6 /100 | #106 | Exceptional 93.5% |
| Immigrants | Norway | 98.4 /100 | #107 | Exceptional 93.5% |
| Alaska Natives | 98.4 /100 | #108 | Exceptional 93.5% |
| Immigrants | Kuwait | 98.4 /100 | #109 | Exceptional 93.5% |
| Syrians | 98.4 /100 | #110 | Exceptional 93.4% |
| Yugoslavians | 98.1 /100 | #111 | Exceptional 93.4% |
| Immigrants | Germany | 98.0 /100 | #112 | Exceptional 93.4% |
| Immigrants | Zimbabwe | 97.8 /100 | #113 | Exceptional 93.4% |
| Jordanians | 97.8 /100 | #114 | Exceptional 93.4% |
| Palestinians | 97.7 /100 | #115 | Exceptional 93.4% |
| Immigrants | Hungary | 97.5 /100 | #116 | Exceptional 93.4% |
| Whites/Caucasians | 97.4 /100 | #117 | Exceptional 93.3% |
| Immigrants | Korea | 97.0 /100 | #118 | Exceptional 93.3% |
| Israelis | 97.0 /100 | #119 | Exceptional 93.3% |
| Immigrants | Russia | 96.6 /100 | #120 | Exceptional 93.3% |
| German Russians | 96.4 /100 | #121 | Exceptional 93.3% |
| Immigrants | Belarus | 96.3 /100 | #122 | Exceptional 93.3% |