Yup'ik vs Immigrants from North America 11th Grade
COMPARE
Yup'ik
Immigrants from North America
11th Grade
11th Grade Comparison
Yup'ik
Immigrants from North America
91.2%
11TH GRADE
0.3/ 100
METRIC RATING
264th/ 347
METRIC RANK
94.0%
11TH GRADE
99.9/ 100
METRIC RATING
54th/ 347
METRIC RANK
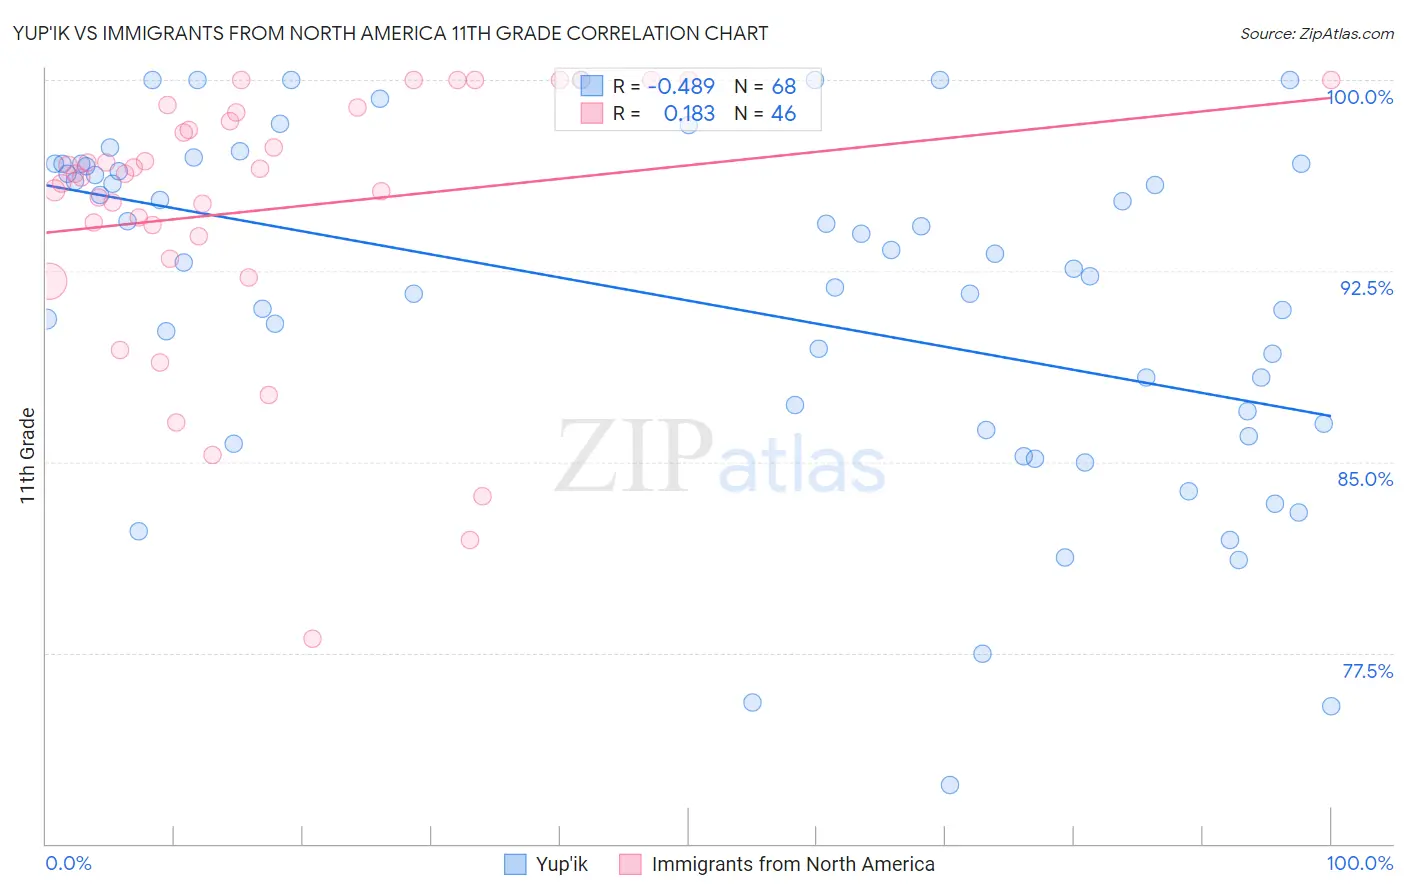
Yup'ik vs Immigrants from North America 11th Grade Correlation Chart
The statistical analysis conducted on geographies consisting of 39,964,654 people shows a moderate negative correlation between the proportion of Yup'ik and percentage of population with at least 11th grade education in the United States with a correlation coefficient (R) of -0.489 and weighted average of 91.2%. Similarly, the statistical analysis conducted on geographies consisting of 462,461,913 people shows a poor positive correlation between the proportion of Immigrants from North America and percentage of population with at least 11th grade education in the United States with a correlation coefficient (R) of 0.183 and weighted average of 94.0%, a difference of 3.1%.
11th Grade Correlation Summary
| Measurement | Yup'ik | Immigrants from North America |
| Minimum | 72.3% | 78.1% |
| Maximum | 100.0% | 100.0% |
| Range | 27.7% | 21.9% |
| Mean | 91.3% | 94.9% |
| Median | 92.7% | 96.3% |
| Interquartile 25% (IQ1) | 86.4% | 93.9% |
| Interquartile 75% (IQ3) | 96.7% | 98.7% |
| Interquartile Range (IQR) | 10.3% | 4.9% |
| Standard Deviation (Sample) | 6.8% | 5.2% |
| Standard Deviation (Population) | 6.7% | 5.2% |
Similar Demographics by 11th Grade
Demographics Similar to Yup'ik by 11th Grade
In terms of 11th grade, the demographic groups most similar to Yup'ik are Pueblo (91.2%, a difference of 0.0%), Immigrants from Ghana (91.2%, a difference of 0.020%), Immigrants from Western Africa (91.2%, a difference of 0.030%), Immigrants from Jamaica (91.2%, a difference of 0.030%), and U.S. Virgin Islander (91.1%, a difference of 0.11%).
| Demographics | Rating | Rank | 11th Grade |
| Cajuns | 0.7 /100 | #257 | Tragic 91.4% |
| Immigrants | Colombia | 0.6 /100 | #258 | Tragic 91.4% |
| Jamaicans | 0.6 /100 | #259 | Tragic 91.4% |
| Spanish Americans | 0.6 /100 | #260 | Tragic 91.4% |
| Taiwanese | 0.6 /100 | #261 | Tragic 91.3% |
| Immigrants | Uruguay | 0.5 /100 | #262 | Tragic 91.3% |
| Immigrants | Ghana | 0.3 /100 | #263 | Tragic 91.2% |
| Yup'ik | 0.3 /100 | #264 | Tragic 91.2% |
| Pueblo | 0.3 /100 | #265 | Tragic 91.2% |
| Immigrants | Western Africa | 0.3 /100 | #266 | Tragic 91.2% |
| Immigrants | Jamaica | 0.3 /100 | #267 | Tragic 91.2% |
| U.S. Virgin Islanders | 0.2 /100 | #268 | Tragic 91.1% |
| Ute | 0.2 /100 | #269 | Tragic 91.1% |
| Trinidadians and Tobagonians | 0.2 /100 | #270 | Tragic 91.1% |
| Immigrants | Peru | 0.1 /100 | #271 | Tragic 91.0% |
Demographics Similar to Immigrants from North America by 11th Grade
In terms of 11th grade, the demographic groups most similar to Immigrants from North America are Czechoslovakian (94.0%, a difference of 0.0%), Immigrants from Australia (94.0%, a difference of 0.010%), French Canadian (94.0%, a difference of 0.010%), New Zealander (94.0%, a difference of 0.010%), and Iranian (94.0%, a difference of 0.010%).
| Demographics | Rating | Rank | 11th Grade |
| Filipinos | 99.9 /100 | #47 | Exceptional 94.1% |
| Macedonians | 99.9 /100 | #48 | Exceptional 94.1% |
| Slavs | 99.9 /100 | #49 | Exceptional 94.1% |
| French | 99.9 /100 | #50 | Exceptional 94.1% |
| Turks | 99.9 /100 | #51 | Exceptional 94.0% |
| Immigrants | Canada | 99.9 /100 | #52 | Exceptional 94.0% |
| Immigrants | Australia | 99.9 /100 | #53 | Exceptional 94.0% |
| Immigrants | North America | 99.9 /100 | #54 | Exceptional 94.0% |
| Czechoslovakians | 99.9 /100 | #55 | Exceptional 94.0% |
| French Canadians | 99.9 /100 | #56 | Exceptional 94.0% |
| New Zealanders | 99.9 /100 | #57 | Exceptional 94.0% |
| Iranians | 99.9 /100 | #58 | Exceptional 94.0% |
| Bhutanese | 99.8 /100 | #59 | Exceptional 94.0% |
| Okinawans | 99.8 /100 | #60 | Exceptional 94.0% |
| Immigrants | Belgium | 99.8 /100 | #61 | Exceptional 94.0% |