Yuman vs Tlingit-Haida In Labor Force | Age 45-54
COMPARE
Yuman
Tlingit-Haida
In Labor Force | Age 45-54
In Labor Force | Age 45-54 Comparison
Yuman
Tlingit-Haida
76.3%
IN LABOR FORCE | AGE 45-54
0.0/ 100
METRIC RATING
338th/ 347
METRIC RANK
83.9%
IN LABOR FORCE | AGE 45-54
99.8/ 100
METRIC RATING
23rd/ 347
METRIC RANK
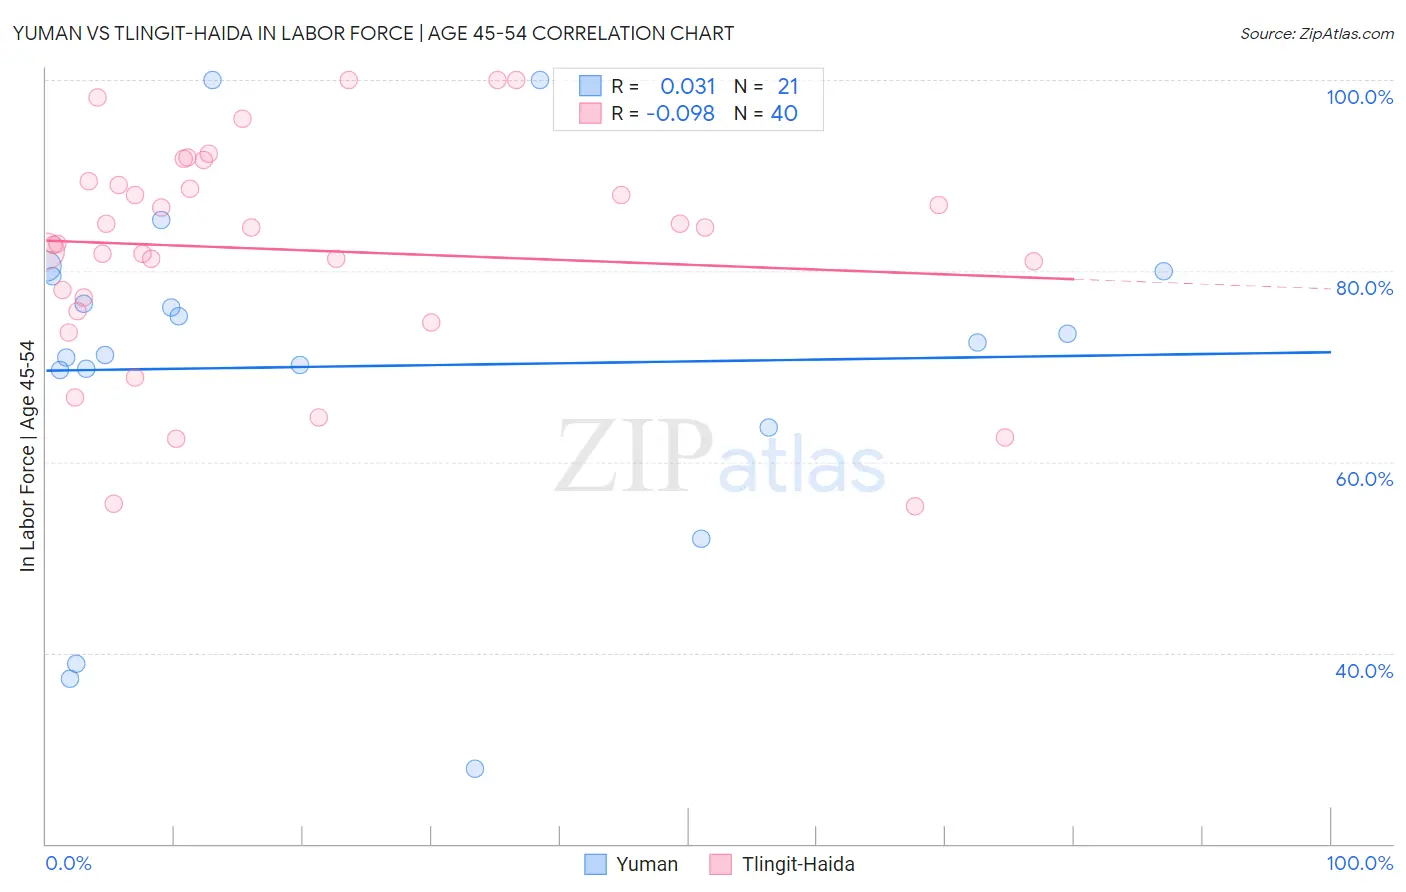
Yuman vs Tlingit-Haida In Labor Force | Age 45-54 Correlation Chart
The statistical analysis conducted on geographies consisting of 40,663,251 people shows no correlation between the proportion of Yuman and labor force participation rate among population between the ages 45 and 54 in the United States with a correlation coefficient (R) of 0.031 and weighted average of 76.3%. Similarly, the statistical analysis conducted on geographies consisting of 60,861,176 people shows a slight negative correlation between the proportion of Tlingit-Haida and labor force participation rate among population between the ages 45 and 54 in the United States with a correlation coefficient (R) of -0.098 and weighted average of 83.9%, a difference of 10.0%.
In Labor Force | Age 45-54 Correlation Summary
| Measurement | Yuman | Tlingit-Haida |
| Minimum | 27.8% | 55.4% |
| Maximum | 100.0% | 100.0% |
| Range | 72.2% | 44.6% |
| Mean | 70.0% | 82.2% |
| Median | 72.5% | 83.7% |
| Interquartile 25% (IQ1) | 66.6% | 76.5% |
| Interquartile 75% (IQ3) | 79.7% | 89.2% |
| Interquartile Range (IQR) | 13.1% | 12.7% |
| Standard Deviation (Sample) | 18.2% | 11.5% |
| Standard Deviation (Population) | 17.8% | 11.4% |
Similar Demographics by In Labor Force | Age 45-54
Demographics Similar to Yuman by In Labor Force | Age 45-54
In terms of in labor force | age 45-54, the demographic groups most similar to Yuman are Ute (76.6%, a difference of 0.41%), Paiute (76.7%, a difference of 0.47%), Puerto Rican (75.9%, a difference of 0.48%), Lumbee (75.6%, a difference of 0.95%), and Arapaho (77.1%, a difference of 1.0%).
| Demographics | Rating | Rank | In Labor Force | Age 45-54 |
| Tsimshian | 0.0 /100 | #331 | Tragic 77.4% |
| Menominee | 0.0 /100 | #332 | Tragic 77.4% |
| Natives/Alaskans | 0.0 /100 | #333 | Tragic 77.1% |
| Apache | 0.0 /100 | #334 | Tragic 77.1% |
| Arapaho | 0.0 /100 | #335 | Tragic 77.1% |
| Paiute | 0.0 /100 | #336 | Tragic 76.7% |
| Ute | 0.0 /100 | #337 | Tragic 76.6% |
| Yuman | 0.0 /100 | #338 | Tragic 76.3% |
| Puerto Ricans | 0.0 /100 | #339 | Tragic 75.9% |
| Lumbee | 0.0 /100 | #340 | Tragic 75.6% |
| Pueblo | 0.0 /100 | #341 | Tragic 75.5% |
| Tohono O'odham | 0.0 /100 | #342 | Tragic 75.1% |
| Hopi | 0.0 /100 | #343 | Tragic 75.0% |
| Immigrants | Yemen | 0.0 /100 | #344 | Tragic 74.4% |
| Houma | 0.0 /100 | #345 | Tragic 74.1% |
Demographics Similar to Tlingit-Haida by In Labor Force | Age 45-54
In terms of in labor force | age 45-54, the demographic groups most similar to Tlingit-Haida are Immigrants from Ireland (83.9%, a difference of 0.0%), Immigrants from Eastern Africa (83.9%, a difference of 0.010%), Immigrants from Sri Lanka (83.9%, a difference of 0.010%), Slovene (83.9%, a difference of 0.010%), and Czech (83.9%, a difference of 0.020%).
| Demographics | Rating | Rank | In Labor Force | Age 45-54 |
| Immigrants | Nepal | 99.9 /100 | #16 | Exceptional 84.0% |
| Zimbabweans | 99.9 /100 | #17 | Exceptional 84.0% |
| Immigrants | South Central Asia | 99.9 /100 | #18 | Exceptional 84.0% |
| Czechs | 99.8 /100 | #19 | Exceptional 83.9% |
| Immigrants | Eastern Africa | 99.8 /100 | #20 | Exceptional 83.9% |
| Immigrants | Sri Lanka | 99.8 /100 | #21 | Exceptional 83.9% |
| Immigrants | Ireland | 99.8 /100 | #22 | Exceptional 83.9% |
| Tlingit-Haida | 99.8 /100 | #23 | Exceptional 83.9% |
| Slovenes | 99.8 /100 | #24 | Exceptional 83.9% |
| Immigrants | North Macedonia | 99.8 /100 | #25 | Exceptional 83.9% |
| Immigrants | Serbia | 99.8 /100 | #26 | Exceptional 83.9% |
| Immigrants | Brazil | 99.8 /100 | #27 | Exceptional 83.9% |
| Immigrants | Lithuania | 99.8 /100 | #28 | Exceptional 83.9% |
| Immigrants | Pakistan | 99.7 /100 | #29 | Exceptional 83.8% |
| Immigrants | Bulgaria | 99.7 /100 | #30 | Exceptional 83.8% |