Australian vs Immigrants from Uruguay College, Under 1 year
COMPARE
Australian
Immigrants from Uruguay
College, Under 1 year
College, Under 1 year Comparison
Australians
Immigrants from Uruguay
70.4%
COLLEGE, UNDER 1 YEAR
99.9/ 100
METRIC RATING
38th/ 347
METRIC RANK
63.4%
COLLEGE, UNDER 1 YEAR
5.8/ 100
METRIC RATING
217th/ 347
METRIC RANK
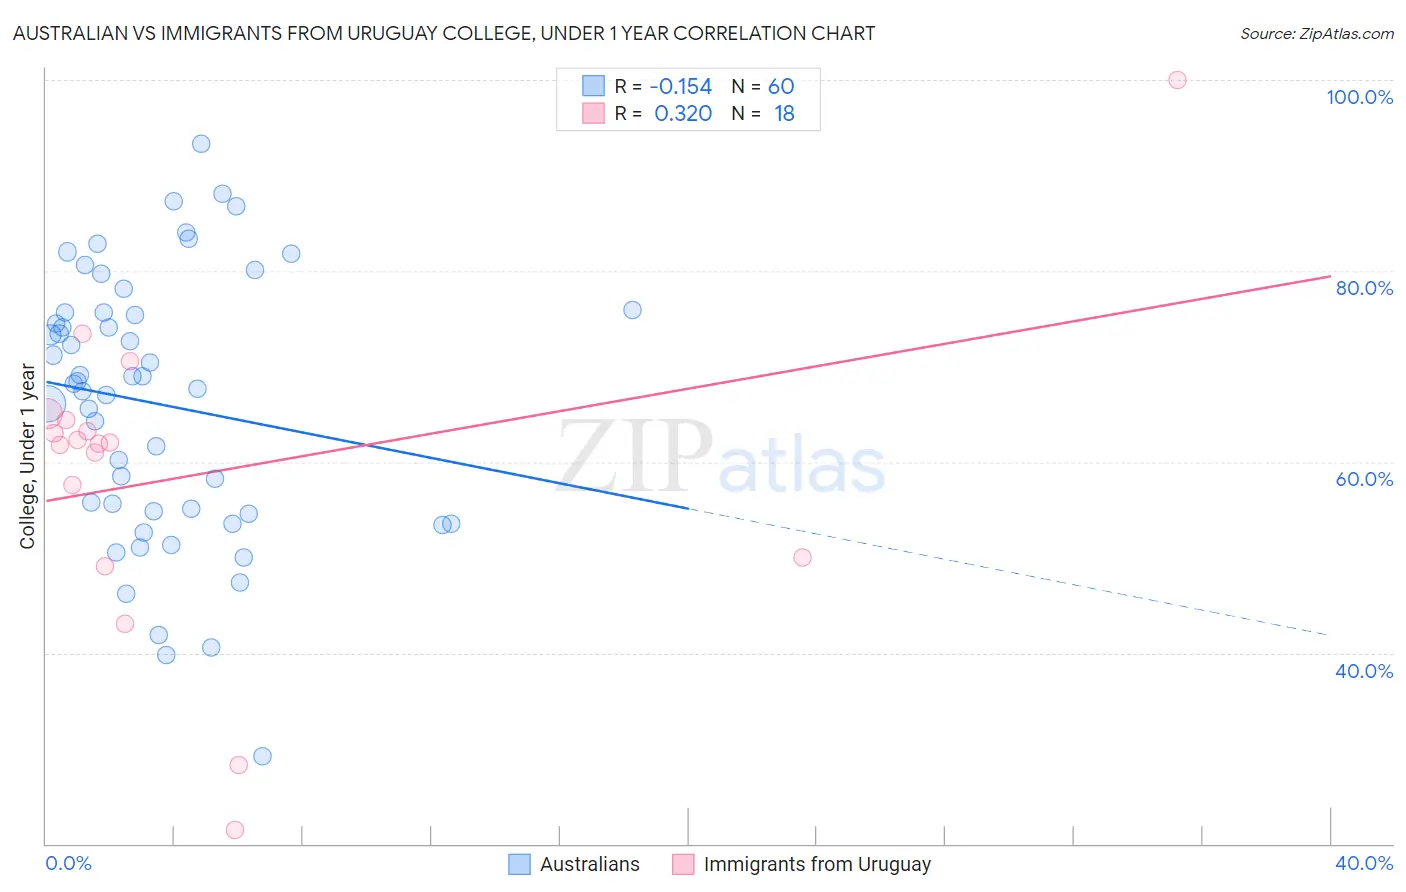
Australian vs Immigrants from Uruguay College, Under 1 year Correlation Chart
The statistical analysis conducted on geographies consisting of 224,162,526 people shows a poor negative correlation between the proportion of Australians and percentage of population with at least college, under 1 year education in the United States with a correlation coefficient (R) of -0.154 and weighted average of 70.4%. Similarly, the statistical analysis conducted on geographies consisting of 133,259,667 people shows a mild positive correlation between the proportion of Immigrants from Uruguay and percentage of population with at least college, under 1 year education in the United States with a correlation coefficient (R) of 0.320 and weighted average of 63.4%, a difference of 11.0%.
College, Under 1 year Correlation Summary
| Measurement | Australian | Immigrants from Uruguay |
| Minimum | 29.1% | 21.5% |
| Maximum | 93.4% | 100.0% |
| Range | 64.2% | 78.5% |
| Mean | 66.0% | 58.8% |
| Median | 68.3% | 62.0% |
| Interquartile 25% (IQ1) | 54.7% | 50.0% |
| Interquartile 75% (IQ3) | 75.6% | 64.4% |
| Interquartile Range (IQR) | 21.0% | 14.4% |
| Standard Deviation (Sample) | 14.0% | 17.1% |
| Standard Deviation (Population) | 13.8% | 16.6% |
Similar Demographics by College, Under 1 year
Demographics Similar to Australians by College, Under 1 year
In terms of college, under 1 year, the demographic groups most similar to Australians are Bhutanese (70.3%, a difference of 0.020%), Immigrants from Turkey (70.3%, a difference of 0.030%), Immigrants from Saudi Arabia (70.4%, a difference of 0.070%), Immigrants from Kuwait (70.3%, a difference of 0.070%), and Immigrants from Lithuania (70.3%, a difference of 0.11%).
| Demographics | Rating | Rank | College, Under 1 year |
| Indians (Asian) | 99.9 /100 | #31 | Exceptional 70.8% |
| Turks | 99.9 /100 | #32 | Exceptional 70.7% |
| Immigrants | South Africa | 99.9 /100 | #33 | Exceptional 70.6% |
| Estonians | 99.9 /100 | #34 | Exceptional 70.6% |
| Russians | 99.9 /100 | #35 | Exceptional 70.5% |
| Immigrants | Sri Lanka | 99.9 /100 | #36 | Exceptional 70.5% |
| Immigrants | Saudi Arabia | 99.9 /100 | #37 | Exceptional 70.4% |
| Australians | 99.9 /100 | #38 | Exceptional 70.4% |
| Bhutanese | 99.9 /100 | #39 | Exceptional 70.3% |
| Immigrants | Turkey | 99.9 /100 | #40 | Exceptional 70.3% |
| Immigrants | Kuwait | 99.9 /100 | #41 | Exceptional 70.3% |
| Immigrants | Lithuania | 99.9 /100 | #42 | Exceptional 70.3% |
| Israelis | 99.9 /100 | #43 | Exceptional 70.2% |
| New Zealanders | 99.9 /100 | #44 | Exceptional 70.2% |
| Immigrants | Norway | 99.9 /100 | #45 | Exceptional 70.2% |
Demographics Similar to Immigrants from Uruguay by College, Under 1 year
In terms of college, under 1 year, the demographic groups most similar to Immigrants from Uruguay are Immigrants from Panama (63.4%, a difference of 0.020%), Immigrants from Fiji (63.4%, a difference of 0.030%), Portuguese (63.4%, a difference of 0.050%), Cree (63.3%, a difference of 0.14%), and Hmong (63.5%, a difference of 0.19%).
| Demographics | Rating | Rank | College, Under 1 year |
| Ghanaians | 11.2 /100 | #210 | Poor 63.9% |
| Native Hawaiians | 10.6 /100 | #211 | Poor 63.9% |
| Immigrants | Middle Africa | 10.5 /100 | #212 | Poor 63.9% |
| Immigrants | South America | 9.1 /100 | #213 | Tragic 63.8% |
| Immigrants | Nigeria | 8.8 /100 | #214 | Tragic 63.7% |
| Senegalese | 7.7 /100 | #215 | Tragic 63.6% |
| Hmong | 6.8 /100 | #216 | Tragic 63.5% |
| Immigrants | Uruguay | 5.8 /100 | #217 | Tragic 63.4% |
| Immigrants | Panama | 5.7 /100 | #218 | Tragic 63.4% |
| Immigrants | Fiji | 5.7 /100 | #219 | Tragic 63.4% |
| Portuguese | 5.6 /100 | #220 | Tragic 63.4% |
| Cree | 5.2 /100 | #221 | Tragic 63.3% |
| Immigrants | Senegal | 5.0 /100 | #222 | Tragic 63.3% |
| Immigrants | Costa Rica | 4.5 /100 | #223 | Tragic 63.2% |
| Sub-Saharan Africans | 4.4 /100 | #224 | Tragic 63.2% |