Yuman vs Immigrants from Argentina Master's Degree
COMPARE
Yuman
Immigrants from Argentina
Master's Degree
Master's Degree Comparison
Yuman
Immigrants from Argentina
9.2%
MASTER'S DEGREE
0.0/ 100
METRIC RATING
345th/ 347
METRIC RANK
18.0%
MASTER'S DEGREE
99.8/ 100
METRIC RATING
67th/ 347
METRIC RANK
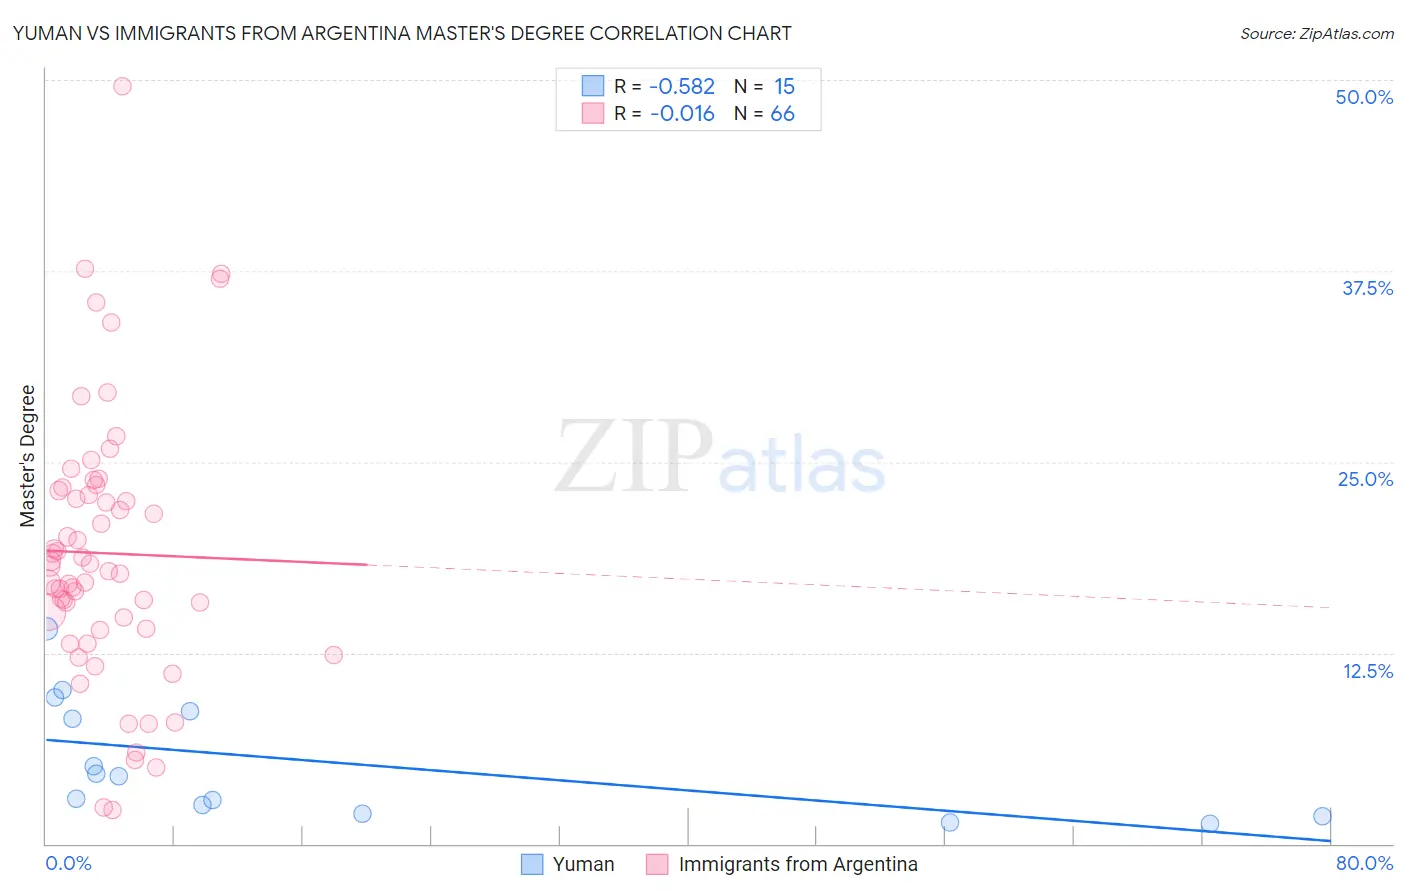
Yuman vs Immigrants from Argentina Master's Degree Correlation Chart
The statistical analysis conducted on geographies consisting of 40,680,215 people shows a substantial negative correlation between the proportion of Yuman and percentage of population with at least master's degree education in the United States with a correlation coefficient (R) of -0.582 and weighted average of 9.2%. Similarly, the statistical analysis conducted on geographies consisting of 264,373,397 people shows no correlation between the proportion of Immigrants from Argentina and percentage of population with at least master's degree education in the United States with a correlation coefficient (R) of -0.016 and weighted average of 18.0%, a difference of 94.5%.
Master's Degree Correlation Summary
| Measurement | Yuman | Immigrants from Argentina |
| Minimum | 1.3% | 2.2% |
| Maximum | 14.1% | 49.6% |
| Range | 12.8% | 47.3% |
| Mean | 5.3% | 19.0% |
| Median | 4.4% | 18.0% |
| Interquartile 25% (IQ1) | 1.9% | 14.1% |
| Interquartile 75% (IQ3) | 8.6% | 23.1% |
| Interquartile Range (IQR) | 6.7% | 9.0% |
| Standard Deviation (Sample) | 3.9% | 8.8% |
| Standard Deviation (Population) | 3.8% | 8.7% |
Similar Demographics by Master's Degree
Demographics Similar to Yuman by Master's Degree
In terms of master's degree, the demographic groups most similar to Yuman are Pima (9.2%, a difference of 0.15%), Lumbee (9.3%, a difference of 0.32%), Immigrants from Mexico (9.3%, a difference of 0.81%), Navajo (9.4%, a difference of 2.1%), and Yakama (9.5%, a difference of 2.5%).
| Demographics | Rating | Rank | Master's Degree |
| Menominee | 0.0 /100 | #333 | Tragic 10.2% |
| Arapaho | 0.0 /100 | #334 | Tragic 10.0% |
| Immigrants | Central America | 0.0 /100 | #335 | Tragic 10.0% |
| Natives/Alaskans | 0.0 /100 | #336 | Tragic 9.9% |
| Mexicans | 0.0 /100 | #337 | Tragic 9.7% |
| Tohono O'odham | 0.0 /100 | #338 | Tragic 9.7% |
| Spanish American Indians | 0.0 /100 | #339 | Tragic 9.6% |
| Yakama | 0.0 /100 | #340 | Tragic 9.5% |
| Navajo | 0.0 /100 | #341 | Tragic 9.4% |
| Immigrants | Mexico | 0.0 /100 | #342 | Tragic 9.3% |
| Lumbee | 0.0 /100 | #343 | Tragic 9.3% |
| Pima | 0.0 /100 | #344 | Tragic 9.2% |
| Yuman | 0.0 /100 | #345 | Tragic 9.2% |
| Yup'ik | 0.0 /100 | #346 | Tragic 8.5% |
| Houma | 0.0 /100 | #347 | Tragic 7.9% |
Demographics Similar to Immigrants from Argentina by Master's Degree
In terms of master's degree, the demographic groups most similar to Immigrants from Argentina are Ethiopian (18.0%, a difference of 0.050%), Immigrants from Kazakhstan (18.0%, a difference of 0.070%), Immigrants from Ethiopia (17.9%, a difference of 0.23%), Immigrants from Uzbekistan (17.9%, a difference of 0.55%), and Immigrants from Western Europe (17.8%, a difference of 0.77%).
| Demographics | Rating | Rank | Master's Degree |
| New Zealanders | 99.9 /100 | #60 | Exceptional 18.3% |
| Immigrants | Europe | 99.9 /100 | #61 | Exceptional 18.2% |
| Argentineans | 99.9 /100 | #62 | Exceptional 18.2% |
| Immigrants | Netherlands | 99.9 /100 | #63 | Exceptional 18.1% |
| South Africans | 99.9 /100 | #64 | Exceptional 18.1% |
| Immigrants | Kazakhstan | 99.8 /100 | #65 | Exceptional 18.0% |
| Ethiopians | 99.8 /100 | #66 | Exceptional 18.0% |
| Immigrants | Argentina | 99.8 /100 | #67 | Exceptional 18.0% |
| Immigrants | Ethiopia | 99.8 /100 | #68 | Exceptional 17.9% |
| Immigrants | Uzbekistan | 99.8 /100 | #69 | Exceptional 17.9% |
| Immigrants | Western Europe | 99.8 /100 | #70 | Exceptional 17.8% |
| Immigrants | Pakistan | 99.7 /100 | #71 | Exceptional 17.8% |
| Lithuanians | 99.7 /100 | #72 | Exceptional 17.7% |
| Zimbabweans | 99.7 /100 | #73 | Exceptional 17.7% |
| Immigrants | Romania | 99.7 /100 | #74 | Exceptional 17.7% |