Malaysian vs Moroccan Bachelor's Degree
COMPARE
Malaysian
Moroccan
Bachelor's Degree
Bachelor's Degree Comparison
Malaysians
Moroccans
32.9%
BACHELOR'S DEGREE
0.5/ 100
METRIC RATING
260th/ 347
METRIC RANK
40.5%
BACHELOR'S DEGREE
94.6/ 100
METRIC RATING
121st/ 347
METRIC RANK
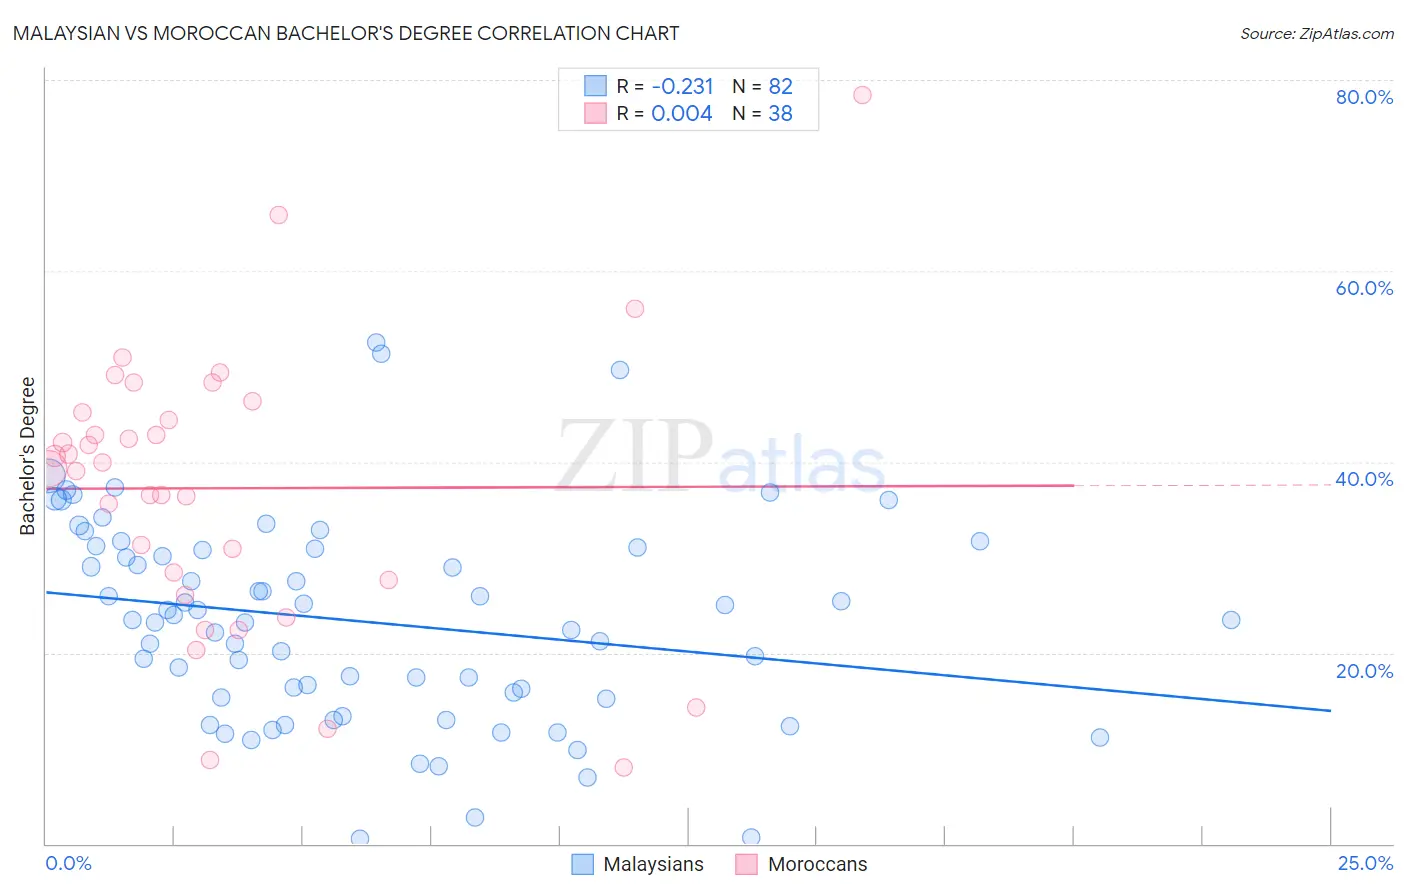
Malaysian vs Moroccan Bachelor's Degree Correlation Chart
The statistical analysis conducted on geographies consisting of 226,101,467 people shows a weak negative correlation between the proportion of Malaysians and percentage of population with at least bachelor's degree education in the United States with a correlation coefficient (R) of -0.231 and weighted average of 32.9%. Similarly, the statistical analysis conducted on geographies consisting of 201,813,734 people shows no correlation between the proportion of Moroccans and percentage of population with at least bachelor's degree education in the United States with a correlation coefficient (R) of 0.004 and weighted average of 40.5%, a difference of 22.9%.
Bachelor's Degree Correlation Summary
| Measurement | Malaysian | Moroccan |
| Minimum | 0.56% | 7.9% |
| Maximum | 52.5% | 78.5% |
| Range | 51.9% | 70.5% |
| Mean | 23.3% | 37.2% |
| Median | 23.4% | 39.6% |
| Interquartile 25% (IQ1) | 15.3% | 27.6% |
| Interquartile 75% (IQ3) | 30.9% | 45.2% |
| Interquartile Range (IQR) | 15.6% | 17.6% |
| Standard Deviation (Sample) | 10.7% | 14.8% |
| Standard Deviation (Population) | 10.7% | 14.6% |
Similar Demographics by Bachelor's Degree
Demographics Similar to Malaysians by Bachelor's Degree
In terms of bachelor's degree, the demographic groups most similar to Malaysians are African (32.9%, a difference of 0.090%), Immigrants from Jamaica (32.9%, a difference of 0.090%), Osage (33.0%, a difference of 0.36%), Belizean (32.8%, a difference of 0.38%), and French American Indian (33.1%, a difference of 0.41%).
| Demographics | Rating | Rank | Bachelor's Degree |
| U.S. Virgin Islanders | 0.7 /100 | #253 | Tragic 33.2% |
| Native Hawaiians | 0.7 /100 | #254 | Tragic 33.2% |
| Iroquois | 0.7 /100 | #255 | Tragic 33.2% |
| Nicaraguans | 0.6 /100 | #256 | Tragic 33.1% |
| Spanish Americans | 0.6 /100 | #257 | Tragic 33.1% |
| French American Indians | 0.6 /100 | #258 | Tragic 33.1% |
| Osage | 0.5 /100 | #259 | Tragic 33.0% |
| Malaysians | 0.5 /100 | #260 | Tragic 32.9% |
| Africans | 0.5 /100 | #261 | Tragic 32.9% |
| Immigrants | Jamaica | 0.5 /100 | #262 | Tragic 32.9% |
| Belizeans | 0.4 /100 | #263 | Tragic 32.8% |
| Central American Indians | 0.3 /100 | #264 | Tragic 32.5% |
| Bahamians | 0.3 /100 | #265 | Tragic 32.5% |
| Immigrants | Dominica | 0.3 /100 | #266 | Tragic 32.5% |
| Cubans | 0.3 /100 | #267 | Tragic 32.5% |
Demographics Similar to Moroccans by Bachelor's Degree
In terms of bachelor's degree, the demographic groups most similar to Moroccans are Venezuelan (40.5%, a difference of 0.050%), Immigrants from Albania (40.4%, a difference of 0.10%), Immigrants from Syria (40.5%, a difference of 0.12%), Lebanese (40.4%, a difference of 0.12%), and Immigrants from Eritrea (40.4%, a difference of 0.12%).
| Demographics | Rating | Rank | Bachelor's Degree |
| Afghans | 96.2 /100 | #114 | Exceptional 40.8% |
| Palestinians | 95.8 /100 | #115 | Exceptional 40.7% |
| Immigrants | Uganda | 95.7 /100 | #116 | Exceptional 40.7% |
| Austrians | 95.5 /100 | #117 | Exceptional 40.6% |
| Croatians | 95.5 /100 | #118 | Exceptional 40.6% |
| Immigrants | Syria | 94.9 /100 | #119 | Exceptional 40.5% |
| Venezuelans | 94.7 /100 | #120 | Exceptional 40.5% |
| Moroccans | 94.6 /100 | #121 | Exceptional 40.5% |
| Immigrants | Albania | 94.4 /100 | #122 | Exceptional 40.4% |
| Lebanese | 94.3 /100 | #123 | Exceptional 40.4% |
| Immigrants | Eritrea | 94.3 /100 | #124 | Exceptional 40.4% |
| British | 94.2 /100 | #125 | Exceptional 40.4% |
| Immigrants | Eastern Africa | 94.1 /100 | #126 | Exceptional 40.4% |
| Immigrants | Jordan | 93.4 /100 | #127 | Exceptional 40.3% |
| Immigrants | Venezuela | 92.9 /100 | #128 | Exceptional 40.2% |