Puget Sound Salish vs Moroccan Bachelor's Degree
COMPARE
Puget Sound Salish
Moroccan
Bachelor's Degree
Bachelor's Degree Comparison
Puget Sound Salish
Moroccans
30.7%
BACHELOR'S DEGREE
0.0/ 100
METRIC RATING
296th/ 347
METRIC RANK
40.5%
BACHELOR'S DEGREE
94.6/ 100
METRIC RATING
121st/ 347
METRIC RANK
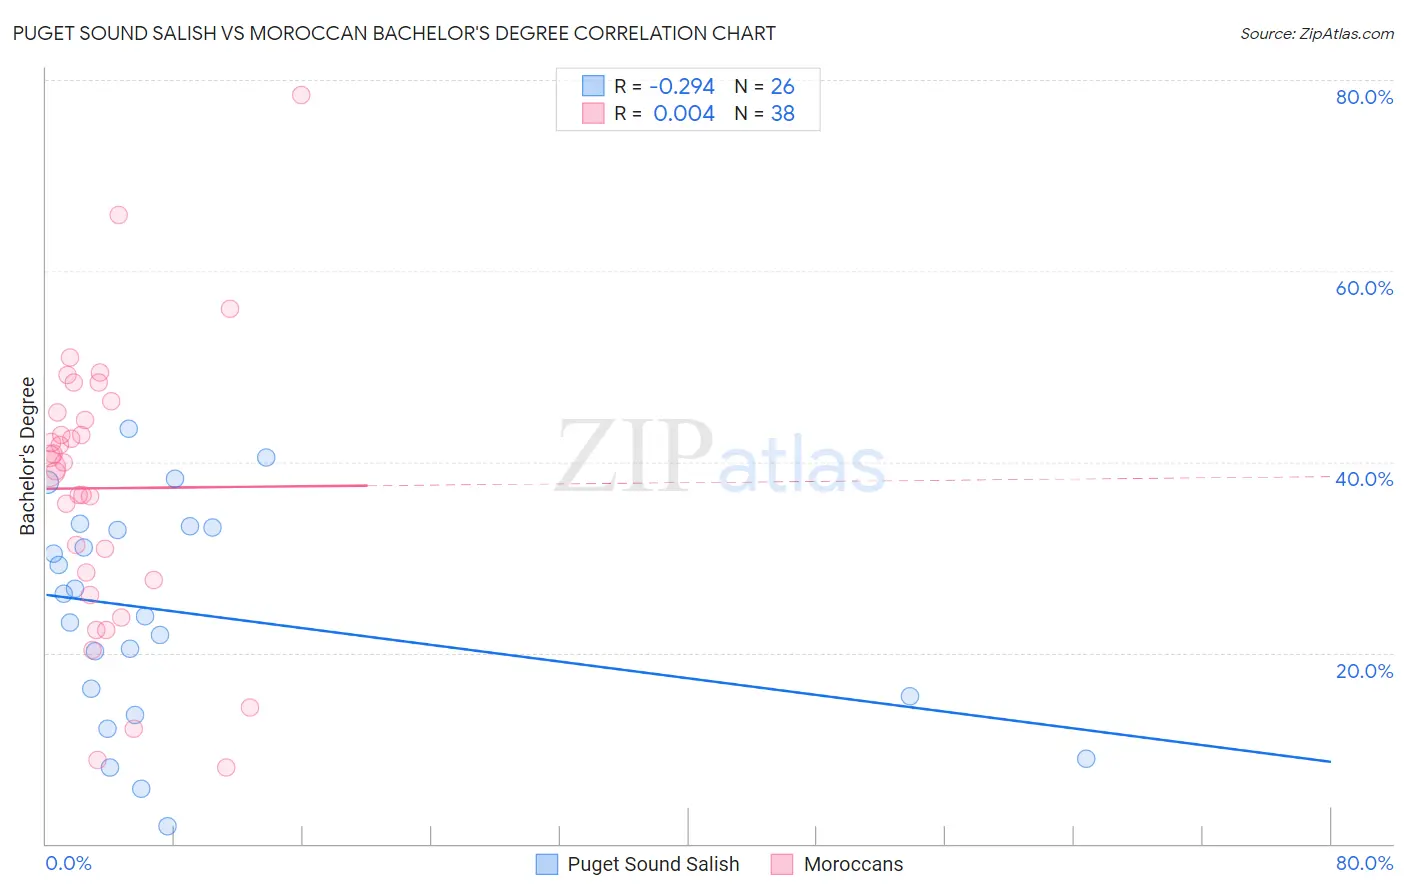
Puget Sound Salish vs Moroccan Bachelor's Degree Correlation Chart
The statistical analysis conducted on geographies consisting of 46,155,865 people shows a weak negative correlation between the proportion of Puget Sound Salish and percentage of population with at least bachelor's degree education in the United States with a correlation coefficient (R) of -0.294 and weighted average of 30.7%. Similarly, the statistical analysis conducted on geographies consisting of 201,813,734 people shows no correlation between the proportion of Moroccans and percentage of population with at least bachelor's degree education in the United States with a correlation coefficient (R) of 0.004 and weighted average of 40.5%, a difference of 32.0%.
Bachelor's Degree Correlation Summary
| Measurement | Puget Sound Salish | Moroccan |
| Minimum | 1.9% | 7.9% |
| Maximum | 43.4% | 78.5% |
| Range | 41.6% | 70.5% |
| Mean | 24.1% | 37.2% |
| Median | 25.0% | 39.6% |
| Interquartile 25% (IQ1) | 15.4% | 27.6% |
| Interquartile 75% (IQ3) | 33.2% | 45.2% |
| Interquartile Range (IQR) | 17.8% | 17.6% |
| Standard Deviation (Sample) | 11.4% | 14.8% |
| Standard Deviation (Population) | 11.2% | 14.6% |
Similar Demographics by Bachelor's Degree
Demographics Similar to Puget Sound Salish by Bachelor's Degree
In terms of bachelor's degree, the demographic groups most similar to Puget Sound Salish are Immigrants from Haiti (30.6%, a difference of 0.060%), Immigrants from Dominican Republic (30.7%, a difference of 0.10%), Chippewa (30.6%, a difference of 0.31%), Immigrants from Guatemala (30.8%, a difference of 0.34%), and Cape Verdean (30.9%, a difference of 0.74%).
| Demographics | Rating | Rank | Bachelor's Degree |
| Puerto Ricans | 0.1 /100 | #289 | Tragic 31.0% |
| Immigrants | Honduras | 0.1 /100 | #290 | Tragic 30.9% |
| Blacks/African Americans | 0.1 /100 | #291 | Tragic 30.9% |
| Ute | 0.1 /100 | #292 | Tragic 30.9% |
| Cape Verdeans | 0.1 /100 | #293 | Tragic 30.9% |
| Immigrants | Guatemala | 0.0 /100 | #294 | Tragic 30.8% |
| Immigrants | Dominican Republic | 0.0 /100 | #295 | Tragic 30.7% |
| Puget Sound Salish | 0.0 /100 | #296 | Tragic 30.7% |
| Immigrants | Haiti | 0.0 /100 | #297 | Tragic 30.6% |
| Chippewa | 0.0 /100 | #298 | Tragic 30.6% |
| Chickasaw | 0.0 /100 | #299 | Tragic 30.4% |
| Immigrants | Micronesia | 0.0 /100 | #300 | Tragic 30.4% |
| Immigrants | Cuba | 0.0 /100 | #301 | Tragic 30.3% |
| Mexican American Indians | 0.0 /100 | #302 | Tragic 30.2% |
| Bangladeshis | 0.0 /100 | #303 | Tragic 30.2% |
Demographics Similar to Moroccans by Bachelor's Degree
In terms of bachelor's degree, the demographic groups most similar to Moroccans are Venezuelan (40.5%, a difference of 0.050%), Immigrants from Albania (40.4%, a difference of 0.10%), Immigrants from Syria (40.5%, a difference of 0.12%), Lebanese (40.4%, a difference of 0.12%), and Immigrants from Eritrea (40.4%, a difference of 0.12%).
| Demographics | Rating | Rank | Bachelor's Degree |
| Afghans | 96.2 /100 | #114 | Exceptional 40.8% |
| Palestinians | 95.8 /100 | #115 | Exceptional 40.7% |
| Immigrants | Uganda | 95.7 /100 | #116 | Exceptional 40.7% |
| Austrians | 95.5 /100 | #117 | Exceptional 40.6% |
| Croatians | 95.5 /100 | #118 | Exceptional 40.6% |
| Immigrants | Syria | 94.9 /100 | #119 | Exceptional 40.5% |
| Venezuelans | 94.7 /100 | #120 | Exceptional 40.5% |
| Moroccans | 94.6 /100 | #121 | Exceptional 40.5% |
| Immigrants | Albania | 94.4 /100 | #122 | Exceptional 40.4% |
| Lebanese | 94.3 /100 | #123 | Exceptional 40.4% |
| Immigrants | Eritrea | 94.3 /100 | #124 | Exceptional 40.4% |
| British | 94.2 /100 | #125 | Exceptional 40.4% |
| Immigrants | Eastern Africa | 94.1 /100 | #126 | Exceptional 40.4% |
| Immigrants | Jordan | 93.4 /100 | #127 | Exceptional 40.3% |
| Immigrants | Venezuela | 92.9 /100 | #128 | Exceptional 40.2% |