Yugoslavian vs Immigrants from Poland Unemployment Among Ages 55 to 59 years
COMPARE
Yugoslavian
Immigrants from Poland
Unemployment Among Ages 55 to 59 years
Unemployment Among Ages 55 to 59 years Comparison
Yugoslavians
Immigrants from Poland
4.7%
UNEMPLOYMENT AMONG AGES 55 TO 59 YEARS
94.7/ 100
METRIC RATING
99th/ 347
METRIC RANK
4.7%
UNEMPLOYMENT AMONG AGES 55 TO 59 YEARS
96.4/ 100
METRIC RATING
90th/ 347
METRIC RANK
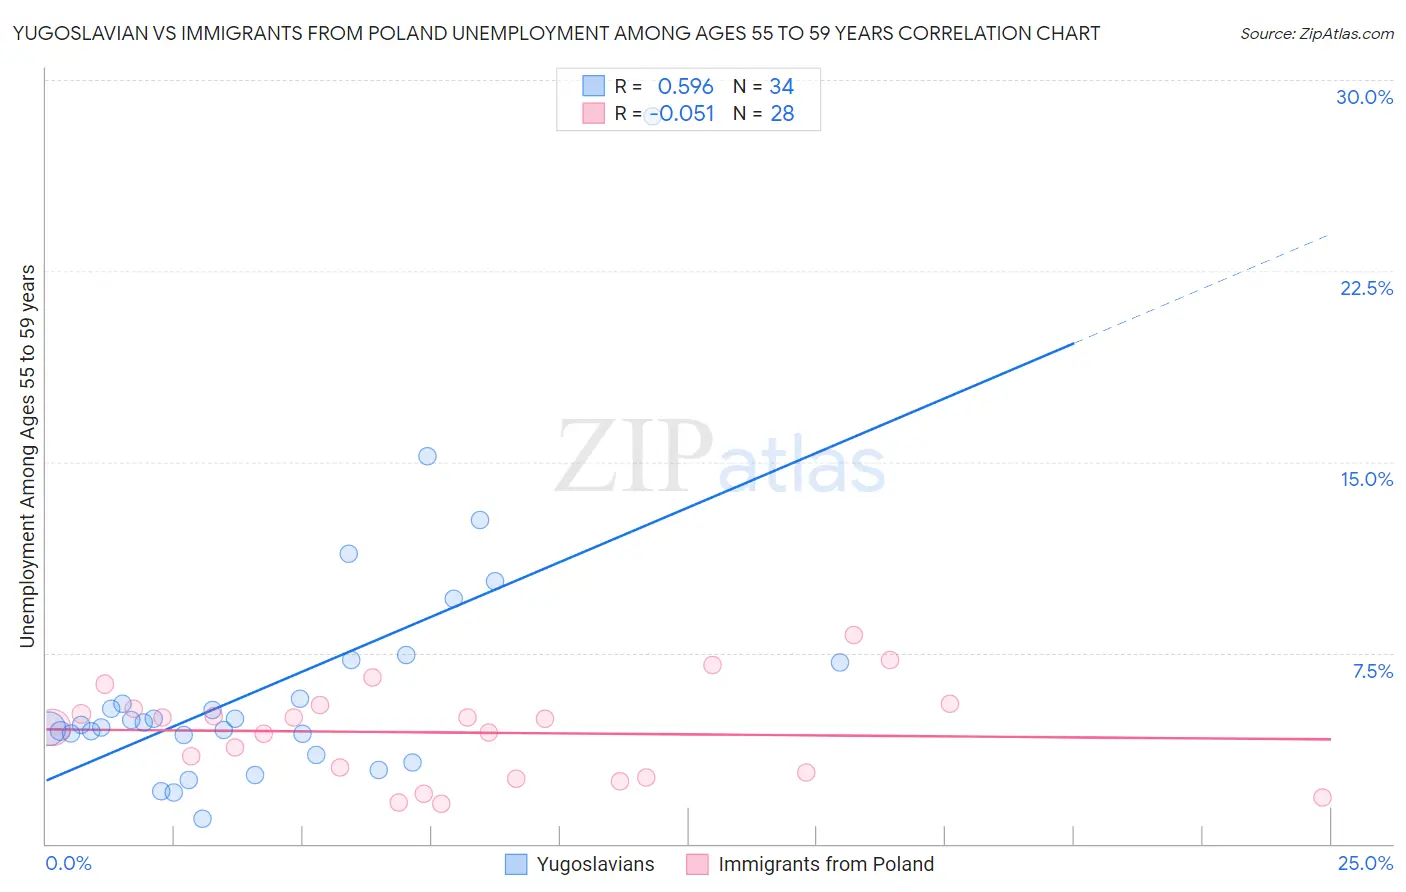
Yugoslavian vs Immigrants from Poland Unemployment Among Ages 55 to 59 years Correlation Chart
The statistical analysis conducted on geographies consisting of 270,151,356 people shows a substantial positive correlation between the proportion of Yugoslavians and unemployment rate among population between the ages 55 and 59 in the United States with a correlation coefficient (R) of 0.596 and weighted average of 4.7%. Similarly, the statistical analysis conducted on geographies consisting of 288,844,390 people shows a slight negative correlation between the proportion of Immigrants from Poland and unemployment rate among population between the ages 55 and 59 in the United States with a correlation coefficient (R) of -0.051 and weighted average of 4.7%, a difference of 0.42%.
Unemployment Among Ages 55 to 59 years Correlation Summary
| Measurement | Yugoslavian | Immigrants from Poland |
| Minimum | 0.97% | 1.6% |
| Maximum | 28.6% | 8.2% |
| Range | 27.6% | 6.6% |
| Mean | 6.2% | 4.4% |
| Median | 4.7% | 4.7% |
| Interquartile 25% (IQ1) | 4.3% | 2.7% |
| Interquartile 75% (IQ3) | 7.1% | 5.4% |
| Interquartile Range (IQR) | 2.8% | 2.7% |
| Standard Deviation (Sample) | 5.0% | 1.8% |
| Standard Deviation (Population) | 5.0% | 1.8% |
Demographics Similar to Yugoslavians and Immigrants from Poland by Unemployment Among Ages 55 to 59 years
In terms of unemployment among ages 55 to 59 years, the demographic groups most similar to Yugoslavians are Immigrants from Germany (4.7%, a difference of 0.020%), Immigrants from Canada (4.7%, a difference of 0.040%), Immigrants from Belgium (4.7%, a difference of 0.050%), Serbian (4.7%, a difference of 0.070%), and Celtic (4.7%, a difference of 0.090%). Similarly, the demographic groups most similar to Immigrants from Poland are New Zealander (4.7%, a difference of 0.020%), Iraqi (4.7%, a difference of 0.10%), Irish (4.7%, a difference of 0.13%), Polish (4.7%, a difference of 0.15%), and Immigrants from Cameroon (4.7%, a difference of 0.15%).
| Demographics | Rating | Rank | Unemployment Among Ages 55 to 59 years |
| Malaysians | 96.9 /100 | #84 | Exceptional 4.7% |
| Immigrants | Vietnam | 96.9 /100 | #85 | Exceptional 4.7% |
| Immigrants | Colombia | 96.9 /100 | #86 | Exceptional 4.7% |
| Poles | 96.9 /100 | #87 | Exceptional 4.7% |
| Immigrants | Cameroon | 96.9 /100 | #88 | Exceptional 4.7% |
| Irish | 96.8 /100 | #89 | Exceptional 4.7% |
| Immigrants | Poland | 96.4 /100 | #90 | Exceptional 4.7% |
| New Zealanders | 96.3 /100 | #91 | Exceptional 4.7% |
| Iraqis | 96.1 /100 | #92 | Exceptional 4.7% |
| Immigrants | England | 95.8 /100 | #93 | Exceptional 4.7% |
| Immigrants | Scotland | 95.7 /100 | #94 | Exceptional 4.7% |
| South Africans | 95.6 /100 | #95 | Exceptional 4.7% |
| Immigrants | Belgium | 95.0 /100 | #96 | Exceptional 4.7% |
| Immigrants | Canada | 94.9 /100 | #97 | Exceptional 4.7% |
| Immigrants | Germany | 94.8 /100 | #98 | Exceptional 4.7% |
| Yugoslavians | 94.7 /100 | #99 | Exceptional 4.7% |
| Serbians | 94.4 /100 | #100 | Exceptional 4.7% |
| Celtics | 94.3 /100 | #101 | Exceptional 4.7% |
| Canadians | 94.1 /100 | #102 | Exceptional 4.7% |
| Immigrants | Oceania | 94.0 /100 | #103 | Exceptional 4.7% |
| Immigrants | Turkey | 93.9 /100 | #104 | Exceptional 4.7% |