Yugoslavian vs Immigrants from Chile Doctorate Degree
COMPARE
Yugoslavian
Immigrants from Chile
Doctorate Degree
Doctorate Degree Comparison
Yugoslavians
Immigrants from Chile
1.7%
DOCTORATE DEGREE
17.1/ 100
METRIC RATING
207th/ 347
METRIC RANK
2.1%
DOCTORATE DEGREE
98.1/ 100
METRIC RATING
102nd/ 347
METRIC RANK
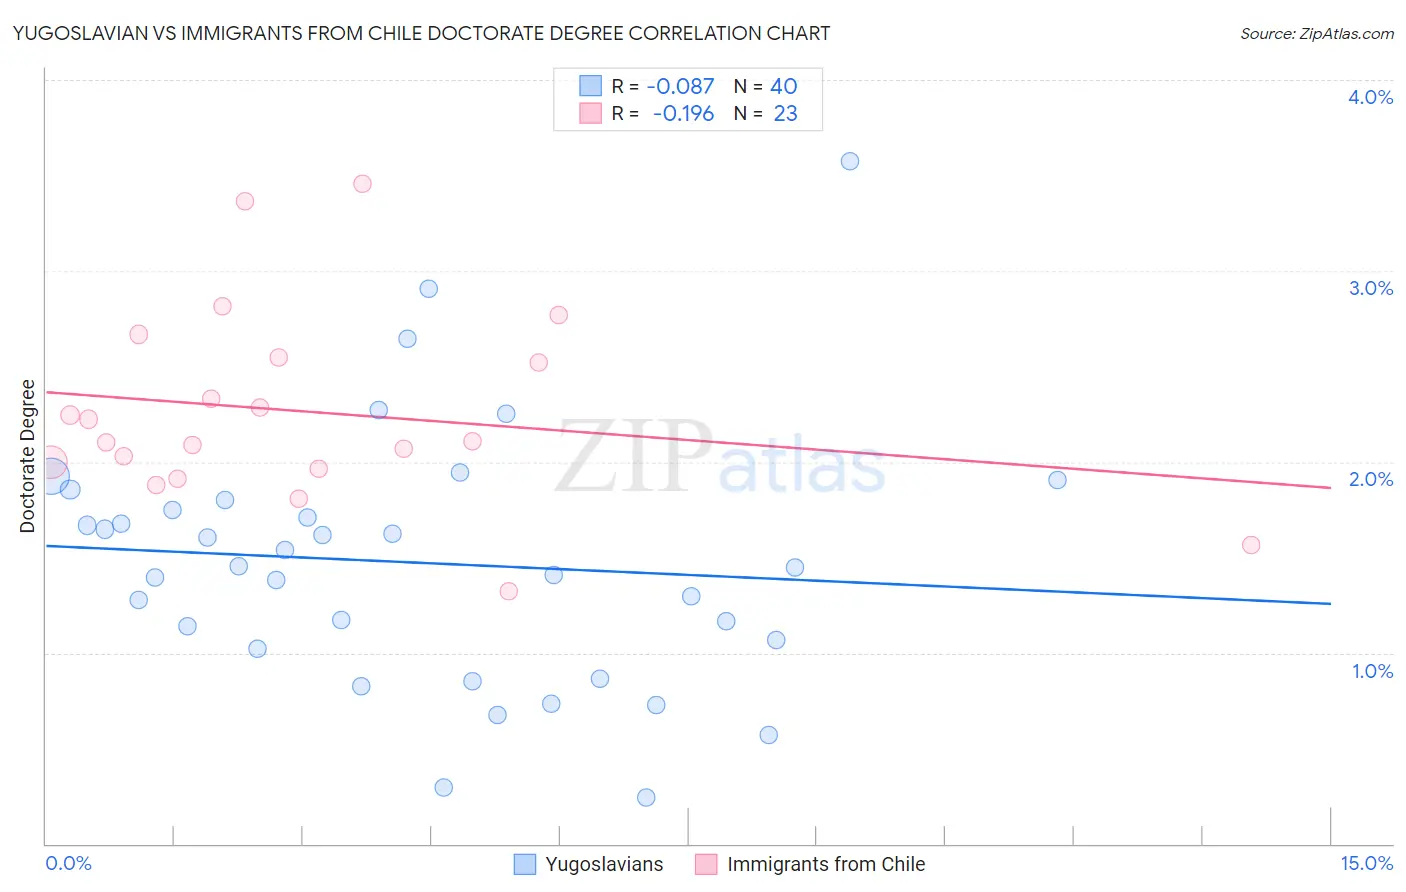
Yugoslavian vs Immigrants from Chile Doctorate Degree Correlation Chart
The statistical analysis conducted on geographies consisting of 283,502,598 people shows a slight negative correlation between the proportion of Yugoslavians and percentage of population with at least doctorate degree education in the United States with a correlation coefficient (R) of -0.087 and weighted average of 1.7%. Similarly, the statistical analysis conducted on geographies consisting of 217,998,165 people shows a poor negative correlation between the proportion of Immigrants from Chile and percentage of population with at least doctorate degree education in the United States with a correlation coefficient (R) of -0.196 and weighted average of 2.1%, a difference of 21.5%.
Doctorate Degree Correlation Summary
| Measurement | Yugoslavian | Immigrants from Chile |
| Minimum | 0.24% | 1.3% |
| Maximum | 3.6% | 3.5% |
| Range | 3.3% | 2.1% |
| Mean | 1.5% | 2.3% |
| Median | 1.4% | 2.1% |
| Interquartile 25% (IQ1) | 1.0% | 2.0% |
| Interquartile 75% (IQ3) | 1.8% | 2.5% |
| Interquartile Range (IQR) | 0.73% | 0.58% |
| Standard Deviation (Sample) | 0.67% | 0.51% |
| Standard Deviation (Population) | 0.66% | 0.50% |
Similar Demographics by Doctorate Degree
Demographics Similar to Yugoslavians by Doctorate Degree
In terms of doctorate degree, the demographic groups most similar to Yugoslavians are Immigrants from Peru (1.7%, a difference of 0.16%), Colombian (1.7%, a difference of 0.28%), Immigrants from Western Africa (1.7%, a difference of 0.47%), Tongan (1.7%, a difference of 0.56%), and Immigrants from Armenia (1.7%, a difference of 0.57%).
| Demographics | Rating | Rank | Doctorate Degree |
| Whites/Caucasians | 22.8 /100 | #200 | Fair 1.8% |
| Immigrants | Nigeria | 22.4 /100 | #201 | Fair 1.8% |
| Portuguese | 21.4 /100 | #202 | Fair 1.8% |
| Immigrants | Vietnam | 21.4 /100 | #203 | Fair 1.8% |
| Somalis | 21.2 /100 | #204 | Fair 1.7% |
| Venezuelans | 19.5 /100 | #205 | Poor 1.7% |
| Immigrants | Peru | 17.6 /100 | #206 | Poor 1.7% |
| Yugoslavians | 17.1 /100 | #207 | Poor 1.7% |
| Colombians | 16.1 /100 | #208 | Poor 1.7% |
| Immigrants | Western Africa | 15.4 /100 | #209 | Poor 1.7% |
| Tongans | 15.1 /100 | #210 | Poor 1.7% |
| Immigrants | Armenia | 15.1 /100 | #211 | Poor 1.7% |
| Immigrants | South Eastern Asia | 14.7 /100 | #212 | Poor 1.7% |
| Koreans | 14.2 /100 | #213 | Poor 1.7% |
| Pueblo | 14.2 /100 | #214 | Poor 1.7% |
Demographics Similar to Immigrants from Chile by Doctorate Degree
In terms of doctorate degree, the demographic groups most similar to Immigrants from Chile are Romanian (2.1%, a difference of 0.010%), Austrian (2.1%, a difference of 0.13%), Immigrants from Eastern Africa (2.1%, a difference of 0.22%), Immigrants from Egypt (2.1%, a difference of 0.25%), and Immigrants from Eastern Europe (2.1%, a difference of 0.25%).
| Demographics | Rating | Rank | Doctorate Degree |
| Immigrants | Romania | 98.7 /100 | #95 | Exceptional 2.1% |
| Immigrants | Northern Africa | 98.4 /100 | #96 | Exceptional 2.1% |
| Immigrants | Eritrea | 98.4 /100 | #97 | Exceptional 2.1% |
| Armenians | 98.3 /100 | #98 | Exceptional 2.1% |
| Immigrants | Egypt | 98.2 /100 | #99 | Exceptional 2.1% |
| Immigrants | Eastern Europe | 98.2 /100 | #100 | Exceptional 2.1% |
| Immigrants | Eastern Africa | 98.2 /100 | #101 | Exceptional 2.1% |
| Immigrants | Chile | 98.1 /100 | #102 | Exceptional 2.1% |
| Romanians | 98.1 /100 | #103 | Exceptional 2.1% |
| Austrians | 98.0 /100 | #104 | Exceptional 2.1% |
| Arabs | 97.8 /100 | #105 | Exceptional 2.1% |
| Sudanese | 97.7 /100 | #106 | Exceptional 2.1% |
| Europeans | 97.5 /100 | #107 | Exceptional 2.1% |
| Immigrants | Germany | 97.3 /100 | #108 | Exceptional 2.1% |
| Ukrainians | 97.2 /100 | #109 | Exceptional 2.1% |