Yugoslavian vs Immigrants from Portugal Doctorate Degree
COMPARE
Yugoslavian
Immigrants from Portugal
Doctorate Degree
Doctorate Degree Comparison
Yugoslavians
Immigrants from Portugal
1.7%
DOCTORATE DEGREE
17.1/ 100
METRIC RATING
207th/ 347
METRIC RANK
1.5%
DOCTORATE DEGREE
0.8/ 100
METRIC RATING
261st/ 347
METRIC RANK
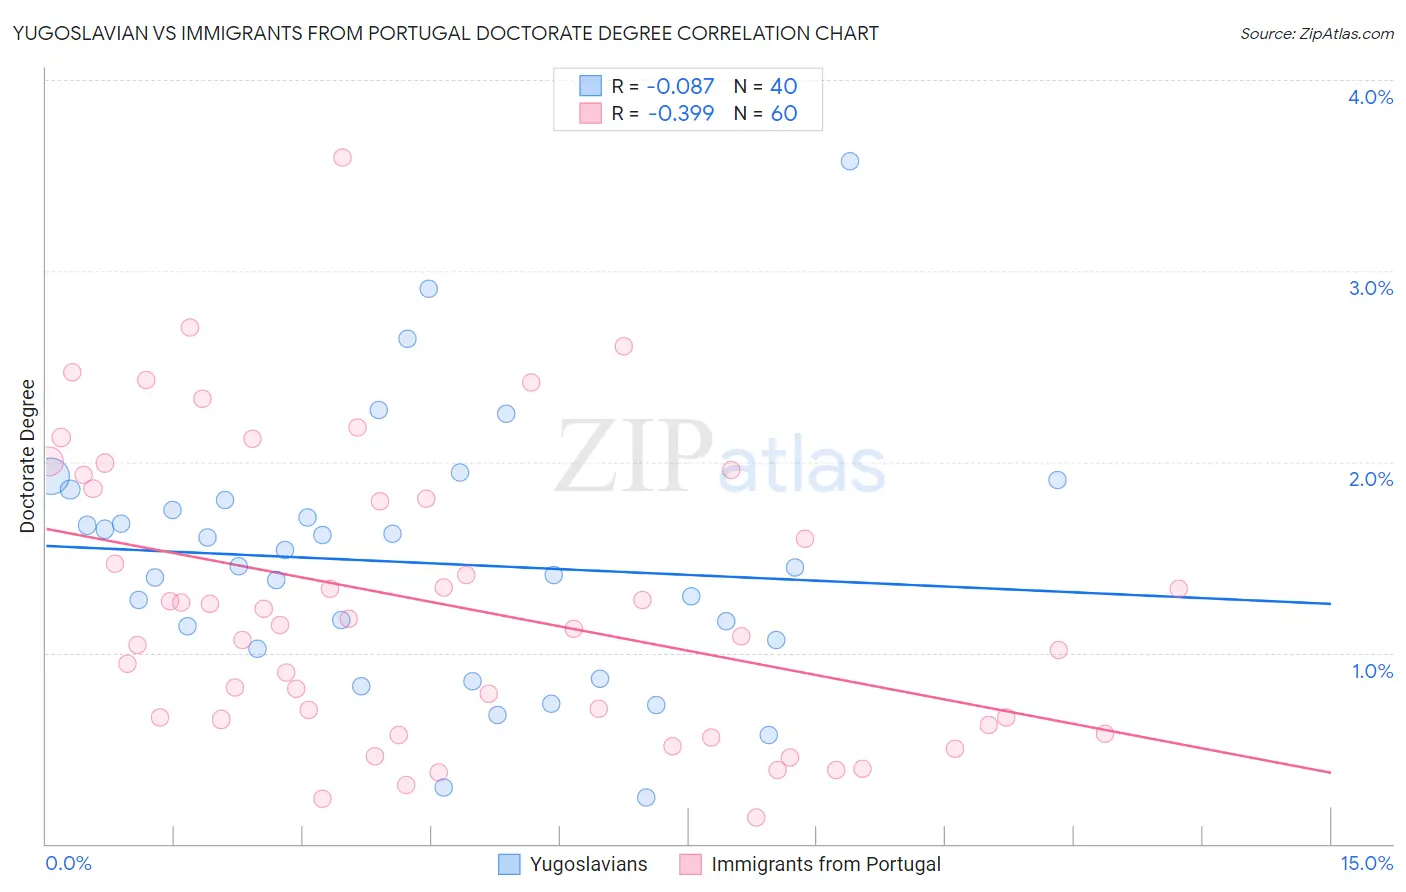
Yugoslavian vs Immigrants from Portugal Doctorate Degree Correlation Chart
The statistical analysis conducted on geographies consisting of 283,502,598 people shows a slight negative correlation between the proportion of Yugoslavians and percentage of population with at least doctorate degree education in the United States with a correlation coefficient (R) of -0.087 and weighted average of 1.7%. Similarly, the statistical analysis conducted on geographies consisting of 173,995,851 people shows a mild negative correlation between the proportion of Immigrants from Portugal and percentage of population with at least doctorate degree education in the United States with a correlation coefficient (R) of -0.399 and weighted average of 1.5%, a difference of 14.6%.
Doctorate Degree Correlation Summary
| Measurement | Yugoslavian | Immigrants from Portugal |
| Minimum | 0.24% | 0.14% |
| Maximum | 3.6% | 3.6% |
| Range | 3.3% | 3.5% |
| Mean | 1.5% | 1.2% |
| Median | 1.4% | 1.1% |
| Interquartile 25% (IQ1) | 1.0% | 0.64% |
| Interquartile 75% (IQ3) | 1.8% | 1.8% |
| Interquartile Range (IQR) | 0.73% | 1.2% |
| Standard Deviation (Sample) | 0.67% | 0.75% |
| Standard Deviation (Population) | 0.66% | 0.75% |
Similar Demographics by Doctorate Degree
Demographics Similar to Yugoslavians by Doctorate Degree
In terms of doctorate degree, the demographic groups most similar to Yugoslavians are Immigrants from Peru (1.7%, a difference of 0.16%), Colombian (1.7%, a difference of 0.28%), Immigrants from Western Africa (1.7%, a difference of 0.47%), Tongan (1.7%, a difference of 0.56%), and Immigrants from Armenia (1.7%, a difference of 0.57%).
| Demographics | Rating | Rank | Doctorate Degree |
| Whites/Caucasians | 22.8 /100 | #200 | Fair 1.8% |
| Immigrants | Nigeria | 22.4 /100 | #201 | Fair 1.8% |
| Portuguese | 21.4 /100 | #202 | Fair 1.8% |
| Immigrants | Vietnam | 21.4 /100 | #203 | Fair 1.8% |
| Somalis | 21.2 /100 | #204 | Fair 1.7% |
| Venezuelans | 19.5 /100 | #205 | Poor 1.7% |
| Immigrants | Peru | 17.6 /100 | #206 | Poor 1.7% |
| Yugoslavians | 17.1 /100 | #207 | Poor 1.7% |
| Colombians | 16.1 /100 | #208 | Poor 1.7% |
| Immigrants | Western Africa | 15.4 /100 | #209 | Poor 1.7% |
| Tongans | 15.1 /100 | #210 | Poor 1.7% |
| Immigrants | Armenia | 15.1 /100 | #211 | Poor 1.7% |
| Immigrants | South Eastern Asia | 14.7 /100 | #212 | Poor 1.7% |
| Koreans | 14.2 /100 | #213 | Poor 1.7% |
| Pueblo | 14.2 /100 | #214 | Poor 1.7% |
Demographics Similar to Immigrants from Portugal by Doctorate Degree
In terms of doctorate degree, the demographic groups most similar to Immigrants from Portugal are Chickasaw (1.5%, a difference of 0.15%), Immigrants from Bahamas (1.5%, a difference of 0.32%), Japanese (1.5%, a difference of 0.46%), Blackfeet (1.5%, a difference of 0.51%), and Liberian (1.5%, a difference of 0.56%).
| Demographics | Rating | Rank | Doctorate Degree |
| Immigrants | Cambodia | 1.0 /100 | #254 | Tragic 1.5% |
| Trinidadians and Tobagonians | 1.0 /100 | #255 | Tragic 1.5% |
| Central American Indians | 1.0 /100 | #256 | Tragic 1.5% |
| Chippewa | 0.9 /100 | #257 | Tragic 1.5% |
| Immigrants | West Indies | 0.9 /100 | #258 | Tragic 1.5% |
| Liberians | 0.9 /100 | #259 | Tragic 1.5% |
| Japanese | 0.9 /100 | #260 | Tragic 1.5% |
| Immigrants | Portugal | 0.8 /100 | #261 | Tragic 1.5% |
| Chickasaw | 0.7 /100 | #262 | Tragic 1.5% |
| Immigrants | Bahamas | 0.7 /100 | #263 | Tragic 1.5% |
| Blackfeet | 0.7 /100 | #264 | Tragic 1.5% |
| Nicaraguans | 0.6 /100 | #265 | Tragic 1.5% |
| Immigrants | Liberia | 0.5 /100 | #266 | Tragic 1.5% |
| Kiowa | 0.5 /100 | #267 | Tragic 1.5% |
| U.S. Virgin Islanders | 0.5 /100 | #268 | Tragic 1.5% |