Yakama vs Sudanese GED/Equivalency
COMPARE
Yakama
Sudanese
GED/Equivalency
GED/Equivalency Comparison
Yakama
Sudanese
74.5%
GED/EQUIVALENCY
0.0/ 100
METRIC RATING
347th/ 347
METRIC RANK
85.5%
GED/EQUIVALENCY
35.2/ 100
METRIC RATING
182nd/ 347
METRIC RANK
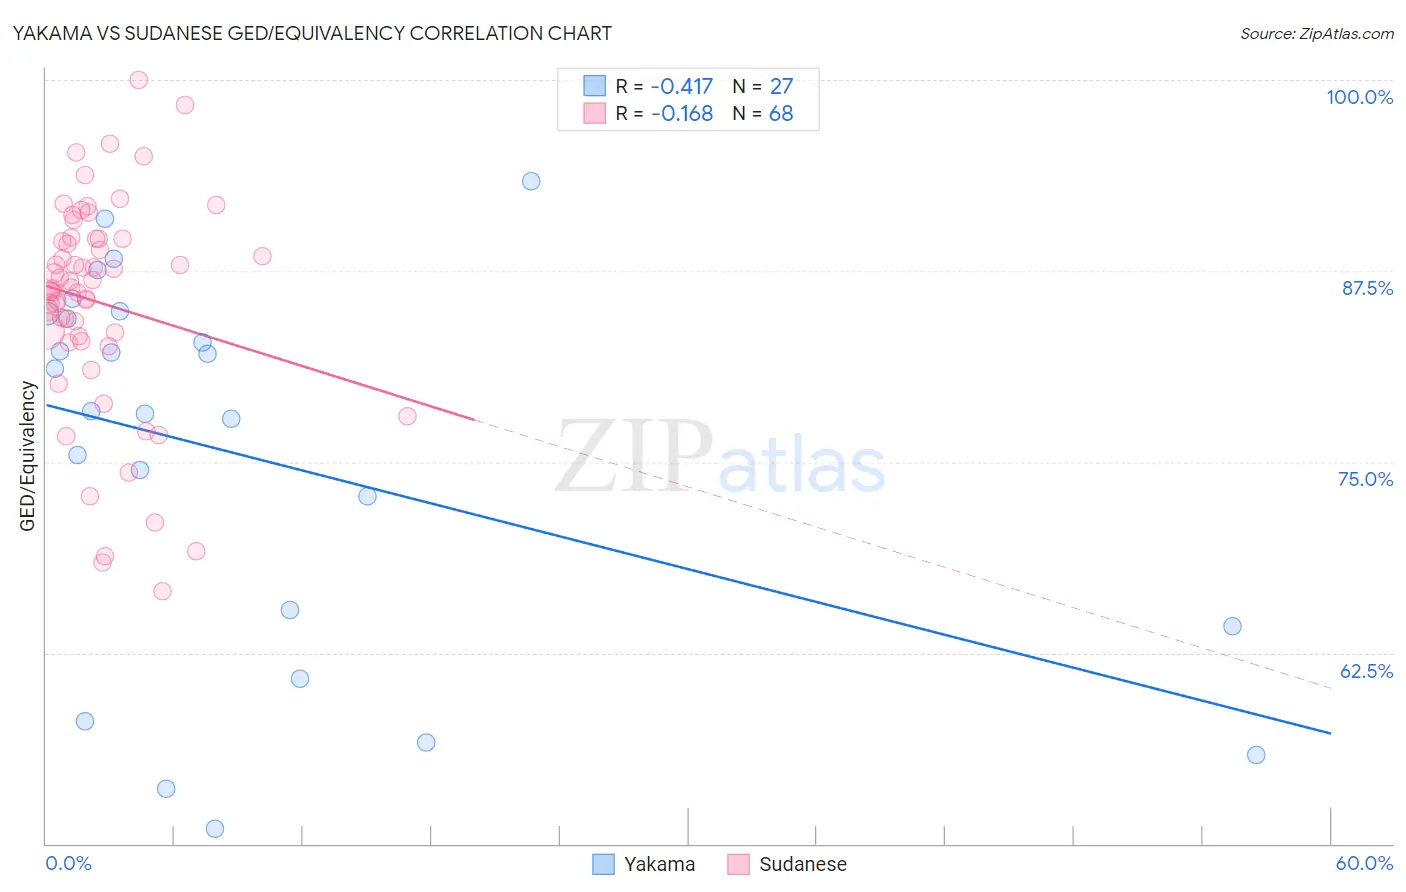
Yakama vs Sudanese GED/Equivalency Correlation Chart
The statistical analysis conducted on geographies consisting of 19,923,144 people shows a moderate negative correlation between the proportion of Yakama and percentage of population with at least ged/equivalency education in the United States with a correlation coefficient (R) of -0.417 and weighted average of 74.5%. Similarly, the statistical analysis conducted on geographies consisting of 110,147,806 people shows a poor negative correlation between the proportion of Sudanese and percentage of population with at least ged/equivalency education in the United States with a correlation coefficient (R) of -0.168 and weighted average of 85.5%, a difference of 14.7%.
GED/Equivalency Correlation Summary
| Measurement | Yakama | Sudanese |
| Minimum | 51.0% | 66.5% |
| Maximum | 93.3% | 100.0% |
| Range | 42.4% | 33.5% |
| Mean | 75.3% | 85.4% |
| Median | 78.4% | 86.4% |
| Interquartile 25% (IQ1) | 64.2% | 83.0% |
| Interquartile 75% (IQ3) | 84.7% | 89.6% |
| Interquartile Range (IQR) | 20.4% | 6.5% |
| Standard Deviation (Sample) | 12.5% | 7.0% |
| Standard Deviation (Population) | 12.2% | 7.0% |
Similar Demographics by GED/Equivalency
Demographics Similar to Yakama by GED/Equivalency
In terms of ged/equivalency, the demographic groups most similar to Yakama are Houma (75.0%, a difference of 0.61%), Immigrants from Mexico (75.7%, a difference of 1.6%), Spanish American Indian (76.3%, a difference of 2.5%), Immigrants from Central America (76.4%, a difference of 2.5%), and Pima (76.4%, a difference of 2.6%).
| Demographics | Rating | Rank | GED/Equivalency |
| Salvadorans | 0.0 /100 | #333 | Tragic 78.6% |
| Guatemalans | 0.0 /100 | #334 | Tragic 78.5% |
| Immigrants | Latin America | 0.0 /100 | #335 | Tragic 78.5% |
| Immigrants | Dominican Republic | 0.0 /100 | #336 | Tragic 78.0% |
| Immigrants | Yemen | 0.0 /100 | #337 | Tragic 77.9% |
| Immigrants | Guatemala | 0.0 /100 | #338 | Tragic 77.9% |
| Immigrants | El Salvador | 0.0 /100 | #339 | Tragic 77.6% |
| Tohono O'odham | 0.0 /100 | #340 | Tragic 77.5% |
| Mexicans | 0.0 /100 | #341 | Tragic 77.4% |
| Pima | 0.0 /100 | #342 | Tragic 76.4% |
| Immigrants | Central America | 0.0 /100 | #343 | Tragic 76.4% |
| Spanish American Indians | 0.0 /100 | #344 | Tragic 76.3% |
| Immigrants | Mexico | 0.0 /100 | #345 | Tragic 75.7% |
| Houma | 0.0 /100 | #346 | Tragic 75.0% |
| Yakama | 0.0 /100 | #347 | Tragic 74.5% |
Demographics Similar to Sudanese by GED/Equivalency
In terms of ged/equivalency, the demographic groups most similar to Sudanese are Immigrants from Sudan (85.5%, a difference of 0.020%), Immigrants from Oceania (85.5%, a difference of 0.040%), Spanish (85.4%, a difference of 0.050%), Moroccan (85.5%, a difference of 0.060%), and Immigrants from Southern Europe (85.5%, a difference of 0.070%).
| Demographics | Rating | Rank | GED/Equivalency |
| Immigrants | Bolivia | 49.8 /100 | #175 | Average 85.8% |
| Immigrants | Eastern Africa | 47.7 /100 | #176 | Average 85.7% |
| Immigrants | Uganda | 45.2 /100 | #177 | Average 85.7% |
| Koreans | 41.2 /100 | #178 | Average 85.6% |
| Aleuts | 40.5 /100 | #179 | Average 85.6% |
| Immigrants | Southern Europe | 38.4 /100 | #180 | Fair 85.5% |
| Moroccans | 37.7 /100 | #181 | Fair 85.5% |
| Sudanese | 35.2 /100 | #182 | Fair 85.5% |
| Immigrants | Sudan | 34.2 /100 | #183 | Fair 85.5% |
| Immigrants | Oceania | 33.6 /100 | #184 | Fair 85.5% |
| Spanish | 32.8 /100 | #185 | Fair 85.4% |
| Spaniards | 31.9 /100 | #186 | Fair 85.4% |
| Immigrants | Afghanistan | 29.8 /100 | #187 | Fair 85.4% |
| Immigrants | Sierra Leone | 29.0 /100 | #188 | Fair 85.4% |
| Guamanians/Chamorros | 28.4 /100 | #189 | Fair 85.3% |