White/Caucasian vs Macedonian 12th Grade, No Diploma
COMPARE
White/Caucasian
Macedonian
12th Grade, No Diploma
12th Grade, No Diploma Comparison
Whites/Caucasians
Macedonians
91.8%
12TH GRADE, NO DIPLOMA
91.6/ 100
METRIC RATING
125th/ 347
METRIC RANK
92.9%
12TH GRADE, NO DIPLOMA
99.8/ 100
METRIC RATING
49th/ 347
METRIC RANK
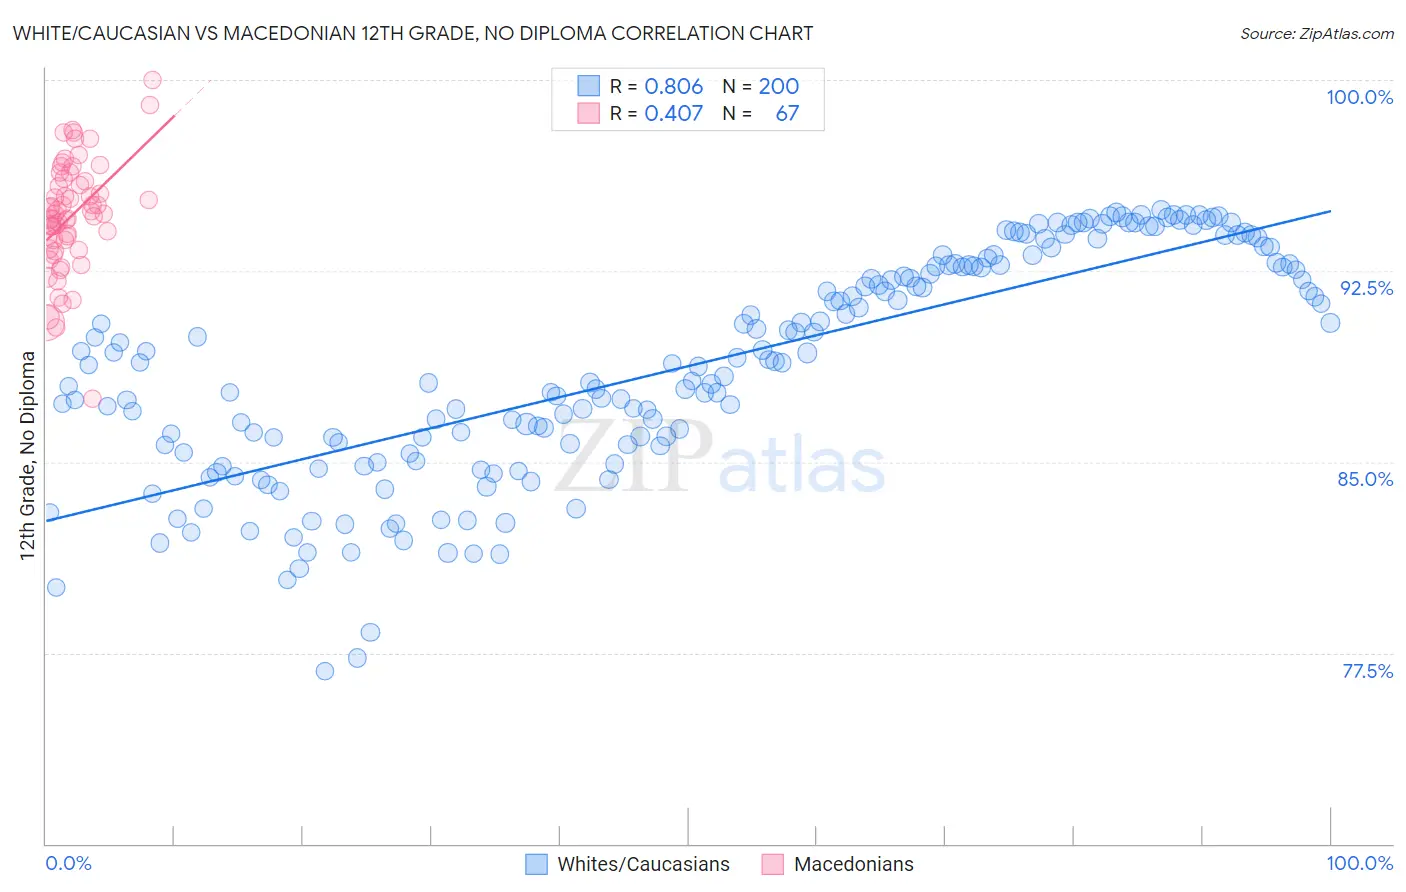
White/Caucasian vs Macedonian 12th Grade, No Diploma Correlation Chart
The statistical analysis conducted on geographies consisting of 585,243,214 people shows a very strong positive correlation between the proportion of Whites/Caucasians and percentage of population with at least 12th grade (no diploma) education in the United States with a correlation coefficient (R) of 0.806 and weighted average of 91.8%. Similarly, the statistical analysis conducted on geographies consisting of 132,645,902 people shows a moderate positive correlation between the proportion of Macedonians and percentage of population with at least 12th grade (no diploma) education in the United States with a correlation coefficient (R) of 0.407 and weighted average of 92.9%, a difference of 1.1%.
12th Grade, No Diploma Correlation Summary
| Measurement | White/Caucasian | Macedonian |
| Minimum | 76.8% | 87.5% |
| Maximum | 94.9% | 100.0% |
| Range | 18.1% | 12.5% |
| Mean | 88.8% | 94.6% |
| Median | 88.9% | 94.8% |
| Interquartile 25% (IQ1) | 85.6% | 93.4% |
| Interquartile 75% (IQ3) | 92.7% | 96.0% |
| Interquartile Range (IQR) | 7.1% | 2.6% |
| Standard Deviation (Sample) | 4.4% | 2.2% |
| Standard Deviation (Population) | 4.4% | 2.2% |
Similar Demographics by 12th Grade, No Diploma
Demographics Similar to Whites/Caucasians by 12th Grade, No Diploma
In terms of 12th grade, no diploma, the demographic groups most similar to Whites/Caucasians are Immigrants from Ukraine (91.8%, a difference of 0.0%), Basque (91.8%, a difference of 0.010%), Immigrants from Jordan (91.8%, a difference of 0.020%), Egyptian (91.9%, a difference of 0.040%), and Mongolian (91.8%, a difference of 0.060%).
| Demographics | Rating | Rank | 12th Grade, No Diploma |
| Puget Sound Salish | 95.8 /100 | #118 | Exceptional 92.0% |
| Immigrants | Germany | 95.5 /100 | #119 | Exceptional 92.0% |
| Immigrants | Kazakhstan | 94.2 /100 | #120 | Exceptional 91.9% |
| Menominee | 93.5 /100 | #121 | Exceptional 91.9% |
| Ottawa | 93.1 /100 | #122 | Exceptional 91.9% |
| Egyptians | 92.5 /100 | #123 | Exceptional 91.9% |
| Immigrants | Ukraine | 91.6 /100 | #124 | Exceptional 91.8% |
| Whites/Caucasians | 91.6 /100 | #125 | Exceptional 91.8% |
| Basques | 91.3 /100 | #126 | Exceptional 91.8% |
| Immigrants | Jordan | 91.0 /100 | #127 | Exceptional 91.8% |
| Mongolians | 89.9 /100 | #128 | Excellent 91.8% |
| German Russians | 89.8 /100 | #129 | Excellent 91.8% |
| Assyrians/Chaldeans/Syriacs | 89.6 /100 | #130 | Excellent 91.8% |
| Albanians | 89.3 /100 | #131 | Excellent 91.8% |
| Immigrants | Eastern Asia | 89.3 /100 | #132 | Excellent 91.8% |
Demographics Similar to Macedonians by 12th Grade, No Diploma
In terms of 12th grade, no diploma, the demographic groups most similar to Macedonians are Australian (92.9%, a difference of 0.010%), Tsimshian (92.9%, a difference of 0.010%), Immigrants from Belgium (92.9%, a difference of 0.010%), Belgian (92.9%, a difference of 0.020%), and British (92.9%, a difference of 0.030%).
| Demographics | Rating | Rank | 12th Grade, No Diploma |
| Immigrants | Australia | 99.8 /100 | #42 | Exceptional 92.9% |
| Northern Europeans | 99.8 /100 | #43 | Exceptional 92.9% |
| Dutch | 99.8 /100 | #44 | Exceptional 92.9% |
| Greeks | 99.8 /100 | #45 | Exceptional 92.9% |
| British | 99.8 /100 | #46 | Exceptional 92.9% |
| Belgians | 99.8 /100 | #47 | Exceptional 92.9% |
| Australians | 99.8 /100 | #48 | Exceptional 92.9% |
| Macedonians | 99.8 /100 | #49 | Exceptional 92.9% |
| Tsimshian | 99.8 /100 | #50 | Exceptional 92.9% |
| Immigrants | Belgium | 99.8 /100 | #51 | Exceptional 92.9% |
| Immigrants | Sweden | 99.8 /100 | #52 | Exceptional 92.8% |
| Serbians | 99.7 /100 | #53 | Exceptional 92.8% |
| Hungarians | 99.7 /100 | #54 | Exceptional 92.8% |
| Welsh | 99.7 /100 | #55 | Exceptional 92.8% |
| New Zealanders | 99.7 /100 | #56 | Exceptional 92.8% |