Native/Alaskan vs Immigrants from Austria 9th Grade
COMPARE
Native/Alaskan
Immigrants from Austria
9th Grade
9th Grade Comparison
Natives/Alaskans
Immigrants from Austria
93.9%
9TH GRADE
0.4/ 100
METRIC RATING
265th/ 347
METRIC RANK
96.0%
9TH GRADE
99.8/ 100
METRIC RATING
55th/ 347
METRIC RANK
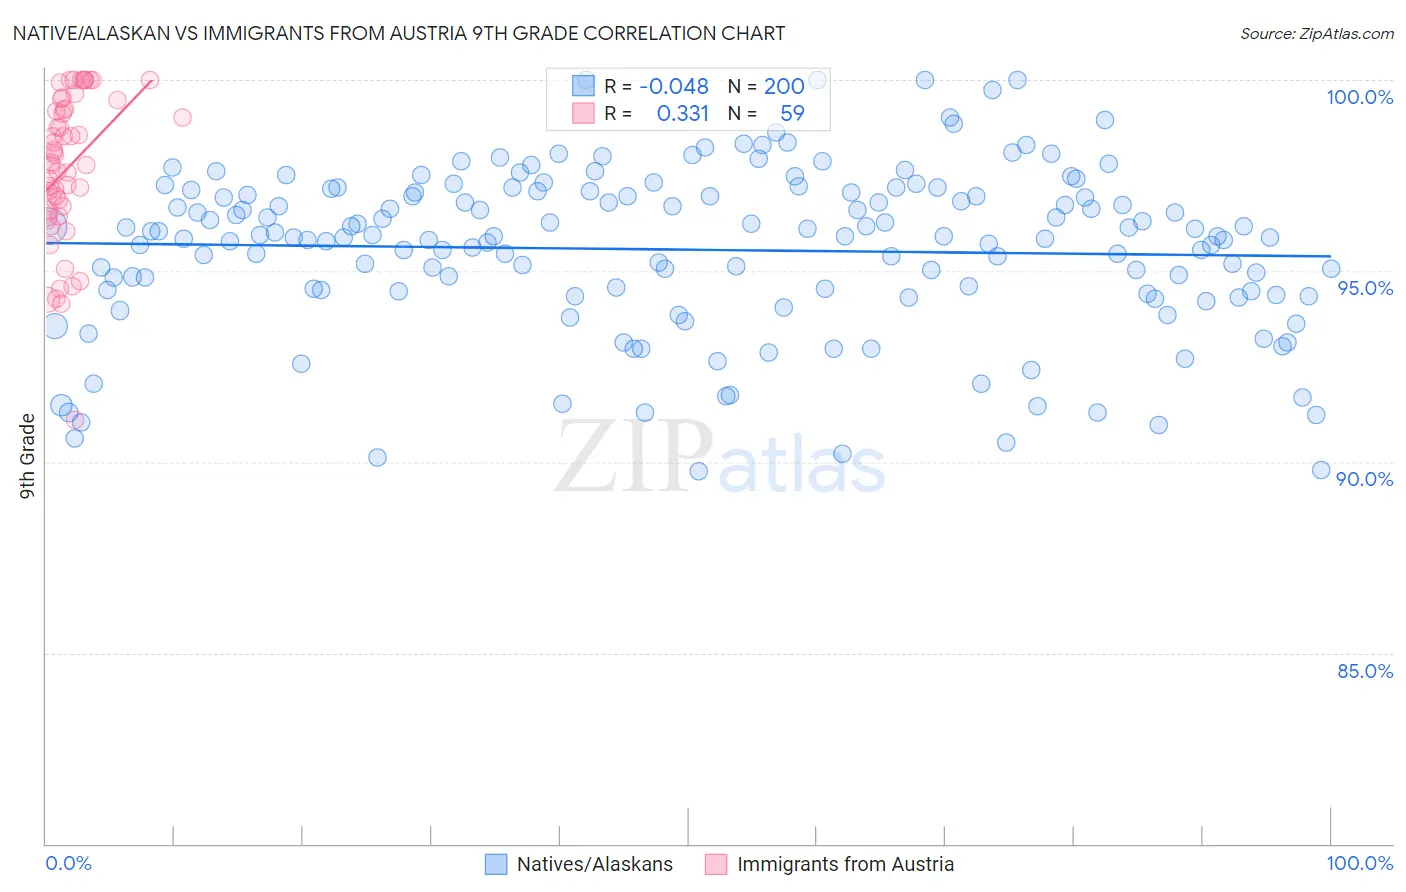
Native/Alaskan vs Immigrants from Austria 9th Grade Correlation Chart
The statistical analysis conducted on geographies consisting of 513,075,822 people shows no correlation between the proportion of Natives/Alaskans and percentage of population with at least 9th grade education in the United States with a correlation coefficient (R) of -0.048 and weighted average of 93.9%. Similarly, the statistical analysis conducted on geographies consisting of 167,973,751 people shows a mild positive correlation between the proportion of Immigrants from Austria and percentage of population with at least 9th grade education in the United States with a correlation coefficient (R) of 0.331 and weighted average of 96.0%, a difference of 2.2%.
9th Grade Correlation Summary
| Measurement | Native/Alaskan | Immigrants from Austria |
| Minimum | 89.8% | 91.1% |
| Maximum | 100.0% | 100.0% |
| Range | 10.2% | 8.9% |
| Mean | 95.6% | 97.7% |
| Median | 95.9% | 97.8% |
| Interquartile 25% (IQ1) | 94.4% | 96.6% |
| Interquartile 75% (IQ3) | 97.1% | 99.2% |
| Interquartile Range (IQR) | 2.6% | 2.7% |
| Standard Deviation (Sample) | 2.2% | 1.9% |
| Standard Deviation (Population) | 2.2% | 1.9% |
Similar Demographics by 9th Grade
Demographics Similar to Natives/Alaskans by 9th Grade
In terms of 9th grade, the demographic groups most similar to Natives/Alaskans are Immigrants from Congo (93.9%, a difference of 0.0%), Immigrants from Jamaica (93.9%, a difference of 0.010%), Immigrants from Uzbekistan (93.9%, a difference of 0.010%), Navajo (93.9%, a difference of 0.010%), and South American (93.9%, a difference of 0.030%).
| Demographics | Rating | Rank | 9th Grade |
| Immigrants | Thailand | 0.5 /100 | #258 | Tragic 93.9% |
| Ghanaians | 0.5 /100 | #259 | Tragic 93.9% |
| Pima | 0.4 /100 | #260 | Tragic 93.9% |
| South Americans | 0.4 /100 | #261 | Tragic 93.9% |
| Immigrants | Jamaica | 0.4 /100 | #262 | Tragic 93.9% |
| Immigrants | Uzbekistan | 0.4 /100 | #263 | Tragic 93.9% |
| Immigrants | Congo | 0.4 /100 | #264 | Tragic 93.9% |
| Natives/Alaskans | 0.4 /100 | #265 | Tragic 93.9% |
| Navajo | 0.3 /100 | #266 | Tragic 93.9% |
| Armenians | 0.3 /100 | #267 | Tragic 93.9% |
| Immigrants | Bolivia | 0.3 /100 | #268 | Tragic 93.9% |
| Immigrants | Uruguay | 0.2 /100 | #269 | Tragic 93.8% |
| Yuman | 0.2 /100 | #270 | Tragic 93.8% |
| Immigrants | Ghana | 0.2 /100 | #271 | Tragic 93.8% |
| Immigrants | Western Africa | 0.2 /100 | #272 | Tragic 93.8% |
Demographics Similar to Immigrants from Austria by 9th Grade
In terms of 9th grade, the demographic groups most similar to Immigrants from Austria are Immigrants from North America (96.0%, a difference of 0.0%), Immigrants from Canada (96.0%, a difference of 0.010%), Macedonian (96.0%, a difference of 0.010%), Aleut (96.0%, a difference of 0.010%), and Austrian (96.0%, a difference of 0.020%).
| Demographics | Rating | Rank | 9th Grade |
| Australians | 99.9 /100 | #48 | Exceptional 96.0% |
| Greeks | 99.9 /100 | #49 | Exceptional 96.0% |
| Celtics | 99.9 /100 | #50 | Exceptional 96.0% |
| Immigrants | Northern Europe | 99.9 /100 | #51 | Exceptional 96.0% |
| Serbians | 99.9 /100 | #52 | Exceptional 96.0% |
| Austrians | 99.8 /100 | #53 | Exceptional 96.0% |
| Immigrants | Canada | 99.8 /100 | #54 | Exceptional 96.0% |
| Immigrants | Austria | 99.8 /100 | #55 | Exceptional 96.0% |
| Immigrants | North America | 99.8 /100 | #56 | Exceptional 96.0% |
| Macedonians | 99.8 /100 | #57 | Exceptional 96.0% |
| Aleuts | 99.8 /100 | #58 | Exceptional 96.0% |
| New Zealanders | 99.8 /100 | #59 | Exceptional 95.9% |
| Native Hawaiians | 99.8 /100 | #60 | Exceptional 95.9% |
| Sioux | 99.8 /100 | #61 | Exceptional 95.9% |
| Ukrainians | 99.7 /100 | #62 | Exceptional 95.9% |