West Indian vs Immigrants from Switzerland Master's Degree
COMPARE
West Indian
Immigrants from Switzerland
Master's Degree
Master's Degree Comparison
West Indians
Immigrants from Switzerland
14.5%
MASTER'S DEGREE
27.4/ 100
METRIC RATING
198th/ 347
METRIC RANK
20.9%
MASTER'S DEGREE
100.0/ 100
METRIC RATING
14th/ 347
METRIC RANK
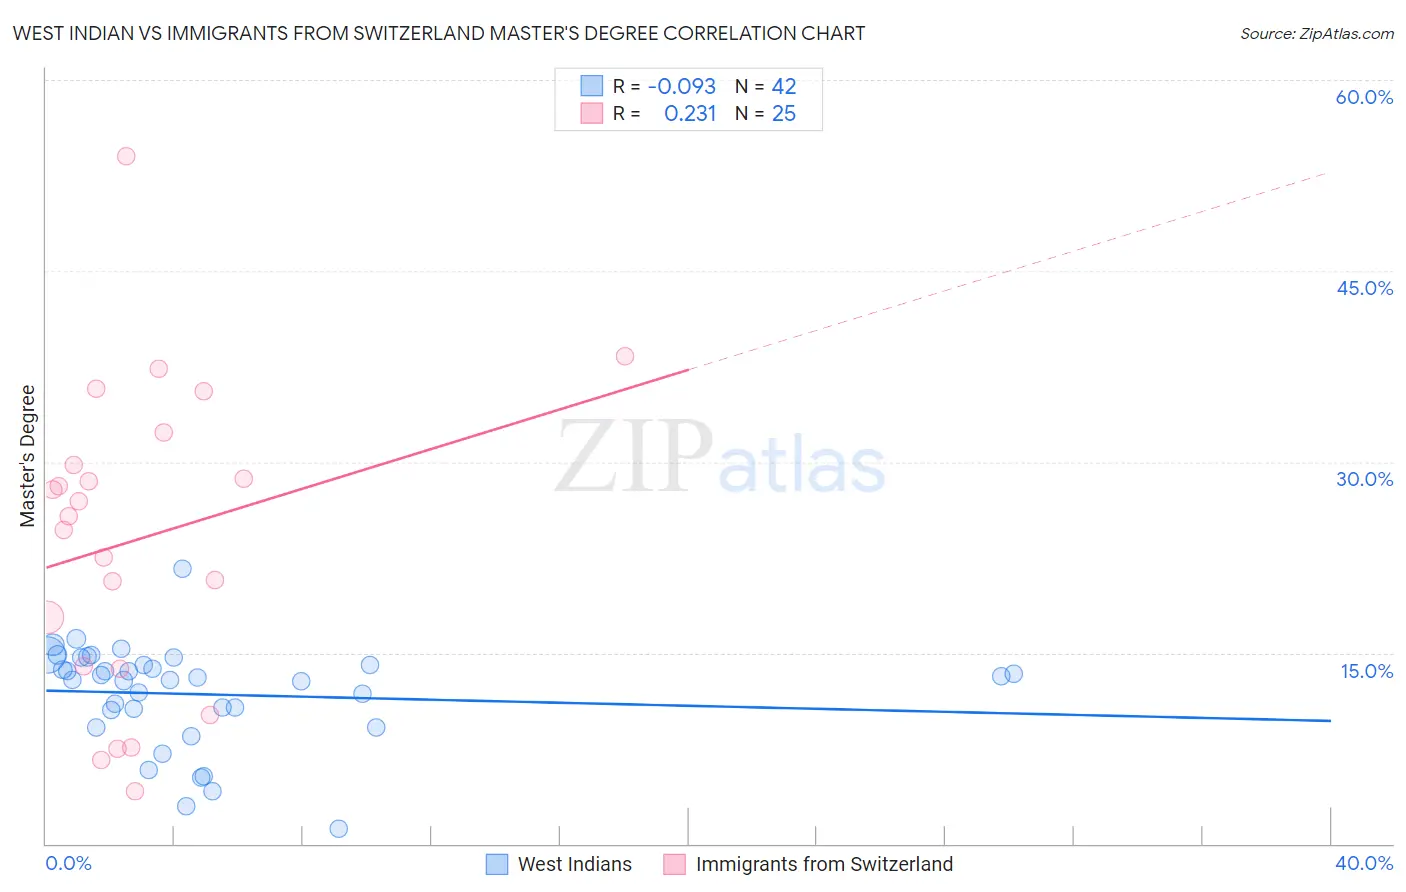
West Indian vs Immigrants from Switzerland Master's Degree Correlation Chart
The statistical analysis conducted on geographies consisting of 253,991,340 people shows a slight negative correlation between the proportion of West Indians and percentage of population with at least master's degree education in the United States with a correlation coefficient (R) of -0.093 and weighted average of 14.5%. Similarly, the statistical analysis conducted on geographies consisting of 148,079,406 people shows a weak positive correlation between the proportion of Immigrants from Switzerland and percentage of population with at least master's degree education in the United States with a correlation coefficient (R) of 0.231 and weighted average of 20.9%, a difference of 44.4%.
Master's Degree Correlation Summary
| Measurement | West Indian | Immigrants from Switzerland |
| Minimum | 1.1% | 4.1% |
| Maximum | 21.6% | 54.0% |
| Range | 20.4% | 50.0% |
| Mean | 11.7% | 23.9% |
| Median | 13.0% | 25.7% |
| Interquartile 25% (IQ1) | 10.5% | 13.9% |
| Interquartile 75% (IQ3) | 14.1% | 31.0% |
| Interquartile Range (IQR) | 3.6% | 17.2% |
| Standard Deviation (Sample) | 4.0% | 12.0% |
| Standard Deviation (Population) | 4.0% | 11.7% |
Similar Demographics by Master's Degree
Demographics Similar to West Indians by Master's Degree
In terms of master's degree, the demographic groups most similar to West Indians are Immigrants from Armenia (14.5%, a difference of 0.040%), Belgian (14.5%, a difference of 0.10%), Panamanian (14.4%, a difference of 0.40%), Czechoslovakian (14.5%, a difference of 0.41%), and Scotch-Irish (14.4%, a difference of 0.41%).
| Demographics | Rating | Rank | Master's Degree |
| Welsh | 34.2 /100 | #191 | Fair 14.6% |
| Immigrants | Middle Africa | 33.6 /100 | #192 | Fair 14.6% |
| Immigrants | Nigeria | 32.7 /100 | #193 | Fair 14.6% |
| Chinese | 32.5 /100 | #194 | Fair 14.6% |
| Danes | 31.3 /100 | #195 | Fair 14.5% |
| Czechoslovakians | 29.9 /100 | #196 | Fair 14.5% |
| Belgians | 28.0 /100 | #197 | Fair 14.5% |
| West Indians | 27.4 /100 | #198 | Fair 14.5% |
| Immigrants | Armenia | 27.2 /100 | #199 | Fair 14.5% |
| Panamanians | 25.1 /100 | #200 | Fair 14.4% |
| Scotch-Irish | 25.0 /100 | #201 | Fair 14.4% |
| Immigrants | Western Africa | 24.9 /100 | #202 | Fair 14.4% |
| Yugoslavians | 24.3 /100 | #203 | Fair 14.4% |
| French | 23.7 /100 | #204 | Fair 14.4% |
| Trinidadians and Tobagonians | 23.5 /100 | #205 | Fair 14.4% |
Demographics Similar to Immigrants from Switzerland by Master's Degree
In terms of master's degree, the demographic groups most similar to Immigrants from Switzerland are Immigrants from Australia (20.9%, a difference of 0.010%), Immigrants from Eastern Asia (20.8%, a difference of 0.18%), Immigrants from Belgium (20.8%, a difference of 0.47%), Immigrants from South Central Asia (20.7%, a difference of 0.73%), and Eastern European (21.1%, a difference of 1.2%).
| Demographics | Rating | Rank | Master's Degree |
| Iranians | 100.0 /100 | #7 | Exceptional 22.3% |
| Cypriots | 100.0 /100 | #8 | Exceptional 21.8% |
| Thais | 100.0 /100 | #9 | Exceptional 21.7% |
| Immigrants | Iran | 100.0 /100 | #10 | Exceptional 21.6% |
| Immigrants | China | 100.0 /100 | #11 | Exceptional 21.2% |
| Eastern Europeans | 100.0 /100 | #12 | Exceptional 21.1% |
| Immigrants | Australia | 100.0 /100 | #13 | Exceptional 20.9% |
| Immigrants | Switzerland | 100.0 /100 | #14 | Exceptional 20.9% |
| Immigrants | Eastern Asia | 100.0 /100 | #15 | Exceptional 20.8% |
| Immigrants | Belgium | 100.0 /100 | #16 | Exceptional 20.8% |
| Immigrants | South Central Asia | 100.0 /100 | #17 | Exceptional 20.7% |
| Soviet Union | 100.0 /100 | #18 | Exceptional 20.5% |
| Immigrants | Hong Kong | 100.0 /100 | #19 | Exceptional 20.5% |
| Indians (Asian) | 100.0 /100 | #20 | Exceptional 20.5% |
| Immigrants | Ireland | 100.0 /100 | #21 | Exceptional 20.4% |