West Indian vs Nigerian Master's Degree
COMPARE
West Indian
Nigerian
Master's Degree
Master's Degree Comparison
West Indians
Nigerians
14.5%
MASTER'S DEGREE
27.4/ 100
METRIC RATING
198th/ 347
METRIC RANK
14.9%
MASTER'S DEGREE
48.6/ 100
METRIC RATING
176th/ 347
METRIC RANK
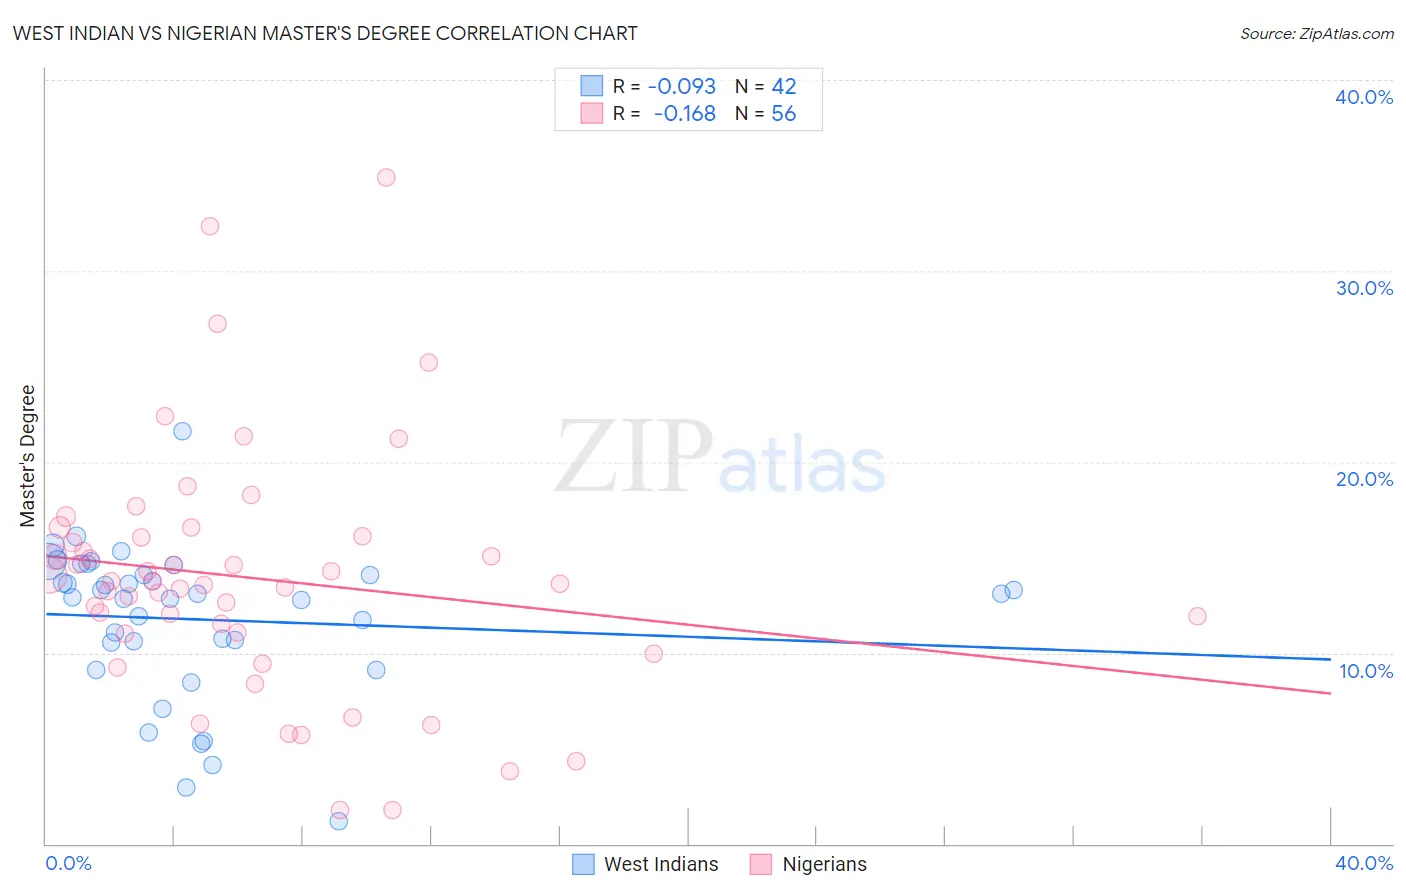
West Indian vs Nigerian Master's Degree Correlation Chart
The statistical analysis conducted on geographies consisting of 253,991,340 people shows a slight negative correlation between the proportion of West Indians and percentage of population with at least master's degree education in the United States with a correlation coefficient (R) of -0.093 and weighted average of 14.5%. Similarly, the statistical analysis conducted on geographies consisting of 332,630,518 people shows a poor negative correlation between the proportion of Nigerians and percentage of population with at least master's degree education in the United States with a correlation coefficient (R) of -0.168 and weighted average of 14.9%, a difference of 3.0%.
Master's Degree Correlation Summary
| Measurement | West Indian | Nigerian |
| Minimum | 1.1% | 1.8% |
| Maximum | 21.6% | 34.9% |
| Range | 20.4% | 33.2% |
| Mean | 11.7% | 13.9% |
| Median | 13.0% | 13.7% |
| Interquartile 25% (IQ1) | 10.5% | 11.0% |
| Interquartile 75% (IQ3) | 14.1% | 16.1% |
| Interquartile Range (IQR) | 3.6% | 5.0% |
| Standard Deviation (Sample) | 4.0% | 6.5% |
| Standard Deviation (Population) | 4.0% | 6.4% |
Similar Demographics by Master's Degree
Demographics Similar to West Indians by Master's Degree
In terms of master's degree, the demographic groups most similar to West Indians are Immigrants from Armenia (14.5%, a difference of 0.040%), Belgian (14.5%, a difference of 0.10%), Panamanian (14.4%, a difference of 0.40%), Czechoslovakian (14.5%, a difference of 0.41%), and Scotch-Irish (14.4%, a difference of 0.41%).
| Demographics | Rating | Rank | Master's Degree |
| Welsh | 34.2 /100 | #191 | Fair 14.6% |
| Immigrants | Middle Africa | 33.6 /100 | #192 | Fair 14.6% |
| Immigrants | Nigeria | 32.7 /100 | #193 | Fair 14.6% |
| Chinese | 32.5 /100 | #194 | Fair 14.6% |
| Danes | 31.3 /100 | #195 | Fair 14.5% |
| Czechoslovakians | 29.9 /100 | #196 | Fair 14.5% |
| Belgians | 28.0 /100 | #197 | Fair 14.5% |
| West Indians | 27.4 /100 | #198 | Fair 14.5% |
| Immigrants | Armenia | 27.2 /100 | #199 | Fair 14.5% |
| Panamanians | 25.1 /100 | #200 | Fair 14.4% |
| Scotch-Irish | 25.0 /100 | #201 | Fair 14.4% |
| Immigrants | Western Africa | 24.9 /100 | #202 | Fair 14.4% |
| Yugoslavians | 24.3 /100 | #203 | Fair 14.4% |
| French | 23.7 /100 | #204 | Fair 14.4% |
| Trinidadians and Tobagonians | 23.5 /100 | #205 | Fair 14.4% |
Demographics Similar to Nigerians by Master's Degree
In terms of master's degree, the demographic groups most similar to Nigerians are Immigrants from Colombia (14.9%, a difference of 0.030%), Immigrants from Peru (14.9%, a difference of 0.14%), Slovak (14.9%, a difference of 0.18%), English (14.8%, a difference of 0.47%), and Costa Rican (15.0%, a difference of 0.50%).
| Demographics | Rating | Rank | Master's Degree |
| Scottish | 62.7 /100 | #169 | Good 15.2% |
| Irish | 56.3 /100 | #170 | Average 15.0% |
| Immigrants | Ghana | 53.6 /100 | #171 | Average 15.0% |
| Immigrants | Uruguay | 52.8 /100 | #172 | Average 15.0% |
| Costa Ricans | 52.5 /100 | #173 | Average 15.0% |
| Slovaks | 50.0 /100 | #174 | Average 14.9% |
| Immigrants | Peru | 49.6 /100 | #175 | Average 14.9% |
| Nigerians | 48.6 /100 | #176 | Average 14.9% |
| Immigrants | Colombia | 48.3 /100 | #177 | Average 14.9% |
| English | 45.0 /100 | #178 | Average 14.8% |
| Immigrants | Iraq | 41.3 /100 | #179 | Average 14.8% |
| Celtics | 41.3 /100 | #180 | Average 14.8% |
| Swiss | 41.1 /100 | #181 | Average 14.7% |
| Czechs | 40.4 /100 | #182 | Average 14.7% |
| Sri Lankans | 39.6 /100 | #183 | Fair 14.7% |