West Indian vs Ute Master's Degree
COMPARE
West Indian
Ute
Master's Degree
Master's Degree Comparison
West Indians
Ute
14.5%
MASTER'S DEGREE
27.4/ 100
METRIC RATING
198th/ 347
METRIC RANK
11.7%
MASTER'S DEGREE
0.1/ 100
METRIC RATING
290th/ 347
METRIC RANK
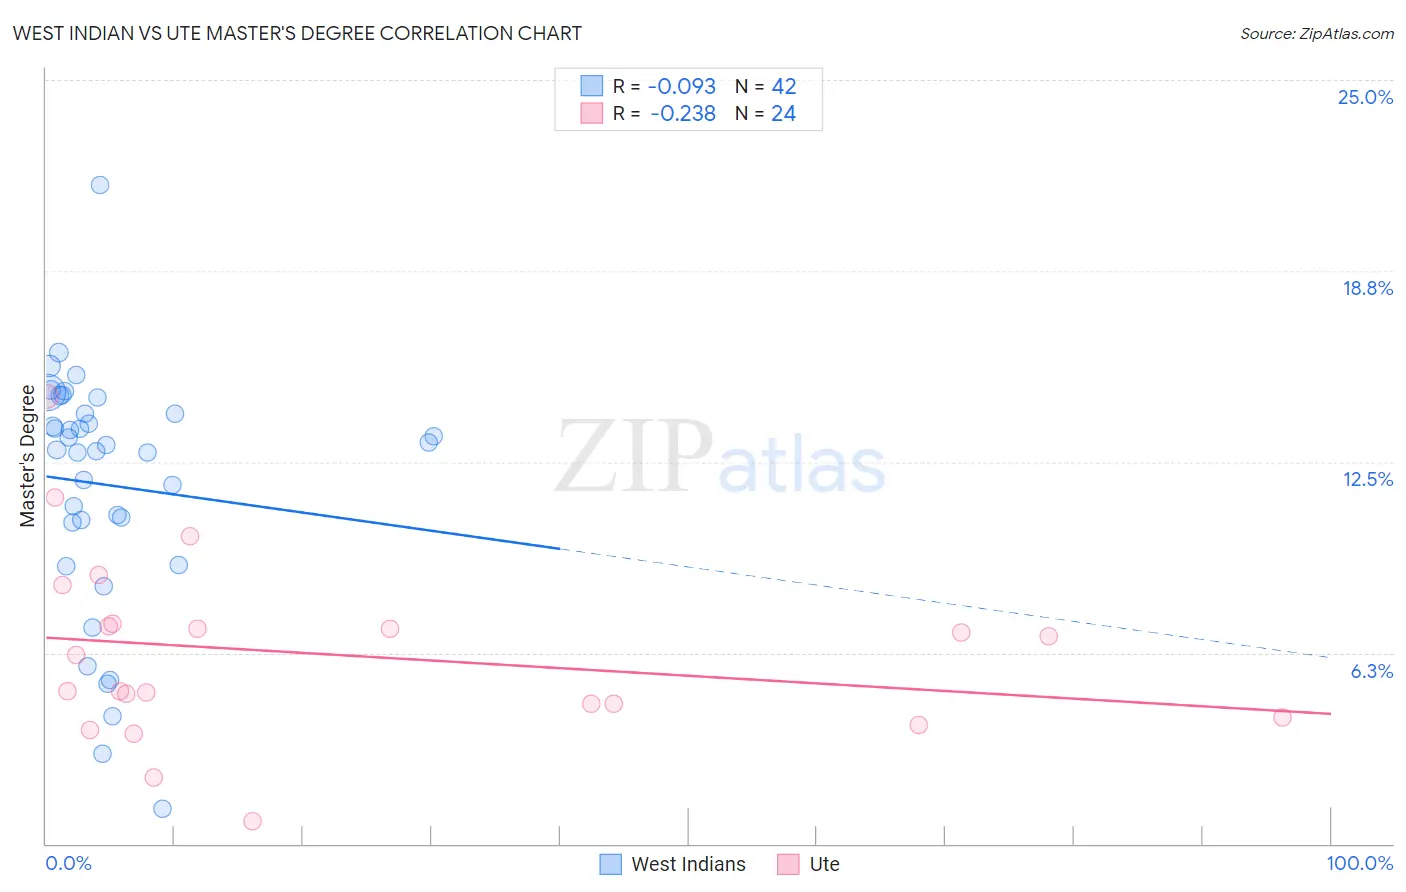
West Indian vs Ute Master's Degree Correlation Chart
The statistical analysis conducted on geographies consisting of 253,991,340 people shows a slight negative correlation between the proportion of West Indians and percentage of population with at least master's degree education in the United States with a correlation coefficient (R) of -0.093 and weighted average of 14.5%. Similarly, the statistical analysis conducted on geographies consisting of 55,657,479 people shows a weak negative correlation between the proportion of Ute and percentage of population with at least master's degree education in the United States with a correlation coefficient (R) of -0.238 and weighted average of 11.7%, a difference of 23.3%.
Master's Degree Correlation Summary
| Measurement | West Indian | Ute |
| Minimum | 1.1% | 0.74% |
| Maximum | 21.6% | 14.6% |
| Range | 20.4% | 13.9% |
| Mean | 11.7% | 6.2% |
| Median | 13.0% | 5.6% |
| Interquartile 25% (IQ1) | 10.5% | 4.4% |
| Interquartile 75% (IQ3) | 14.1% | 7.2% |
| Interquartile Range (IQR) | 3.6% | 2.8% |
| Standard Deviation (Sample) | 4.0% | 3.0% |
| Standard Deviation (Population) | 4.0% | 2.9% |
Similar Demographics by Master's Degree
Demographics Similar to West Indians by Master's Degree
In terms of master's degree, the demographic groups most similar to West Indians are Immigrants from Armenia (14.5%, a difference of 0.040%), Belgian (14.5%, a difference of 0.10%), Panamanian (14.4%, a difference of 0.40%), Czechoslovakian (14.5%, a difference of 0.41%), and Scotch-Irish (14.4%, a difference of 0.41%).
| Demographics | Rating | Rank | Master's Degree |
| Welsh | 34.2 /100 | #191 | Fair 14.6% |
| Immigrants | Middle Africa | 33.6 /100 | #192 | Fair 14.6% |
| Immigrants | Nigeria | 32.7 /100 | #193 | Fair 14.6% |
| Chinese | 32.5 /100 | #194 | Fair 14.6% |
| Danes | 31.3 /100 | #195 | Fair 14.5% |
| Czechoslovakians | 29.9 /100 | #196 | Fair 14.5% |
| Belgians | 28.0 /100 | #197 | Fair 14.5% |
| West Indians | 27.4 /100 | #198 | Fair 14.5% |
| Immigrants | Armenia | 27.2 /100 | #199 | Fair 14.5% |
| Panamanians | 25.1 /100 | #200 | Fair 14.4% |
| Scotch-Irish | 25.0 /100 | #201 | Fair 14.4% |
| Immigrants | Western Africa | 24.9 /100 | #202 | Fair 14.4% |
| Yugoslavians | 24.3 /100 | #203 | Fair 14.4% |
| French | 23.7 /100 | #204 | Fair 14.4% |
| Trinidadians and Tobagonians | 23.5 /100 | #205 | Fair 14.4% |
Demographics Similar to Ute by Master's Degree
In terms of master's degree, the demographic groups most similar to Ute are Guatemalan (11.7%, a difference of 0.24%), Immigrants from Honduras (11.8%, a difference of 0.32%), Immigrants from Haiti (11.8%, a difference of 0.49%), Colville (11.6%, a difference of 0.67%), and Aleut (11.8%, a difference of 0.69%).
| Demographics | Rating | Rank | Master's Degree |
| Hondurans | 0.2 /100 | #283 | Tragic 11.9% |
| Ottawa | 0.2 /100 | #284 | Tragic 11.9% |
| Immigrants | Nicaragua | 0.2 /100 | #285 | Tragic 11.8% |
| Aleuts | 0.1 /100 | #286 | Tragic 11.8% |
| Immigrants | Haiti | 0.1 /100 | #287 | Tragic 11.8% |
| Immigrants | Honduras | 0.1 /100 | #288 | Tragic 11.8% |
| Guatemalans | 0.1 /100 | #289 | Tragic 11.7% |
| Ute | 0.1 /100 | #290 | Tragic 11.7% |
| Colville | 0.1 /100 | #291 | Tragic 11.6% |
| Immigrants | Guatemala | 0.1 /100 | #292 | Tragic 11.6% |
| Alaska Natives | 0.1 /100 | #293 | Tragic 11.6% |
| Hawaiians | 0.1 /100 | #294 | Tragic 11.6% |
| Marshallese | 0.1 /100 | #295 | Tragic 11.6% |
| Alaskan Athabascans | 0.1 /100 | #296 | Tragic 11.6% |
| Immigrants | Yemen | 0.1 /100 | #297 | Tragic 11.6% |