Welsh vs Serbian GED/Equivalency
COMPARE
Welsh
Serbian
GED/Equivalency
GED/Equivalency Comparison
Welsh
Serbians
87.4%
GED/EQUIVALENCY
97.9/ 100
METRIC RATING
90th/ 347
METRIC RANK
87.9%
GED/EQUIVALENCY
99.3/ 100
METRIC RATING
59th/ 347
METRIC RANK
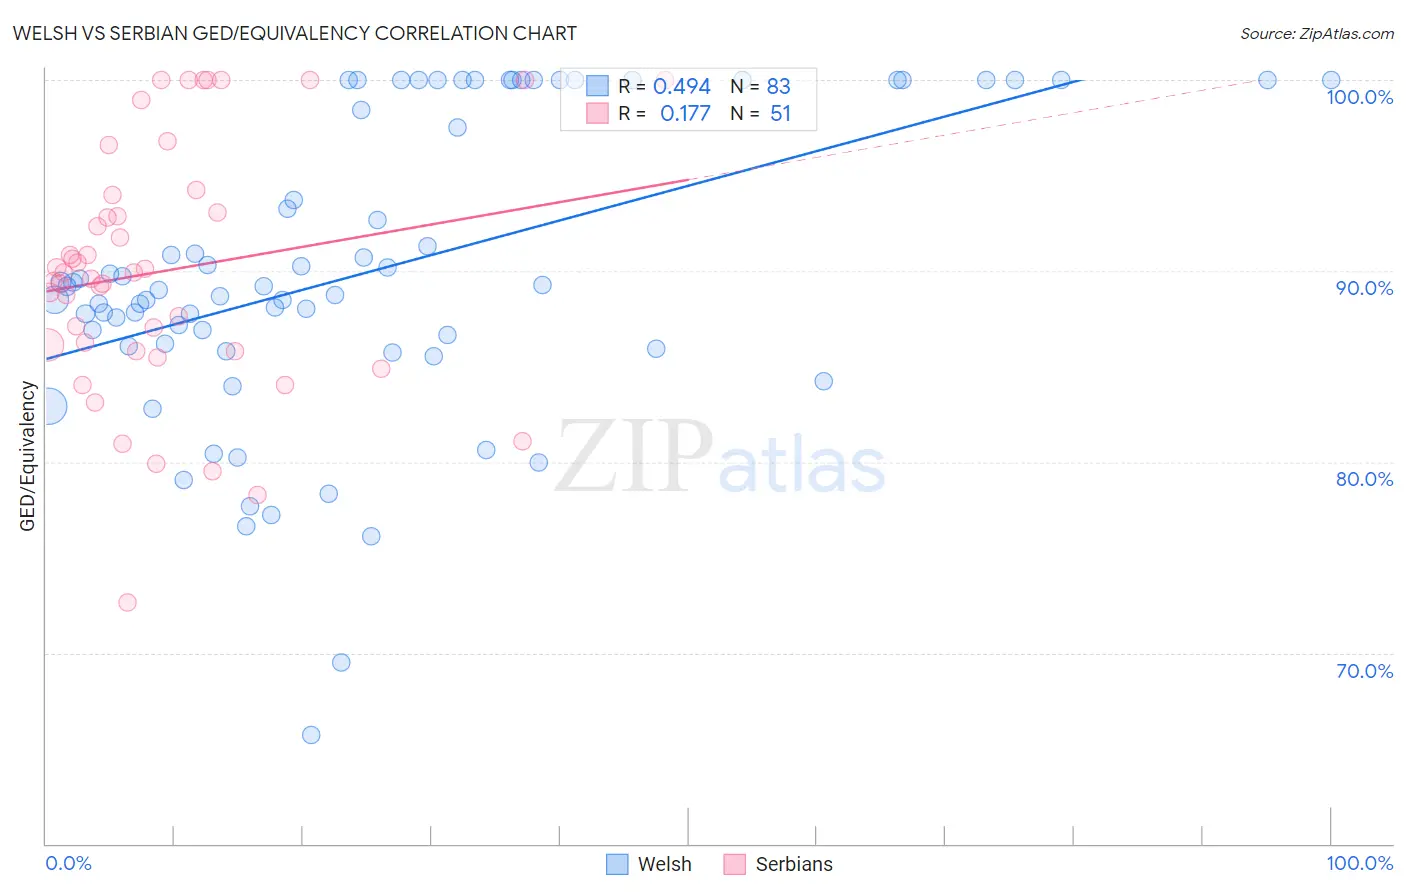
Welsh vs Serbian GED/Equivalency Correlation Chart
The statistical analysis conducted on geographies consisting of 528,596,196 people shows a moderate positive correlation between the proportion of Welsh and percentage of population with at least ged/equivalency education in the United States with a correlation coefficient (R) of 0.494 and weighted average of 87.4%. Similarly, the statistical analysis conducted on geographies consisting of 267,642,942 people shows a poor positive correlation between the proportion of Serbians and percentage of population with at least ged/equivalency education in the United States with a correlation coefficient (R) of 0.177 and weighted average of 87.9%, a difference of 0.55%.
GED/Equivalency Correlation Summary
| Measurement | Welsh | Serbian |
| Minimum | 65.7% | 72.6% |
| Maximum | 100.0% | 100.0% |
| Range | 34.3% | 27.4% |
| Mean | 90.0% | 90.0% |
| Median | 89.2% | 89.9% |
| Interquartile 25% (IQ1) | 86.1% | 85.8% |
| Interquartile 75% (IQ3) | 100.0% | 94.0% |
| Interquartile Range (IQR) | 13.9% | 8.2% |
| Standard Deviation (Sample) | 7.9% | 6.5% |
| Standard Deviation (Population) | 7.8% | 6.4% |
Similar Demographics by GED/Equivalency
Demographics Similar to Welsh by GED/Equivalency
In terms of ged/equivalency, the demographic groups most similar to Welsh are Hungarian (87.4%, a difference of 0.0%), Immigrants from Eastern Asia (87.4%, a difference of 0.010%), Israeli (87.4%, a difference of 0.020%), Immigrants from North Macedonia (87.4%, a difference of 0.030%), and Immigrants from Russia (87.4%, a difference of 0.030%).
| Demographics | Rating | Rank | GED/Equivalency |
| South Africans | 98.3 /100 | #83 | Exceptional 87.5% |
| Immigrants | Romania | 98.1 /100 | #84 | Exceptional 87.5% |
| Dutch | 98.1 /100 | #85 | Exceptional 87.5% |
| Immigrants | Europe | 98.1 /100 | #86 | Exceptional 87.5% |
| Native Hawaiians | 98.1 /100 | #87 | Exceptional 87.5% |
| Immigrants | Norway | 98.1 /100 | #88 | Exceptional 87.5% |
| Hungarians | 97.9 /100 | #89 | Exceptional 87.4% |
| Welsh | 97.9 /100 | #90 | Exceptional 87.4% |
| Immigrants | Eastern Asia | 97.9 /100 | #91 | Exceptional 87.4% |
| Israelis | 97.8 /100 | #92 | Exceptional 87.4% |
| Immigrants | North Macedonia | 97.8 /100 | #93 | Exceptional 87.4% |
| Immigrants | Russia | 97.8 /100 | #94 | Exceptional 87.4% |
| Immigrants | Greece | 97.7 /100 | #95 | Exceptional 87.4% |
| Czechoslovakians | 97.6 /100 | #96 | Exceptional 87.4% |
| Immigrants | Western Europe | 97.3 /100 | #97 | Exceptional 87.3% |
Demographics Similar to Serbians by GED/Equivalency
In terms of ged/equivalency, the demographic groups most similar to Serbians are Immigrants from Czechoslovakia (87.9%, a difference of 0.010%), Northern European (87.9%, a difference of 0.010%), Scandinavian (87.9%, a difference of 0.010%), European (87.9%, a difference of 0.010%), and German (87.9%, a difference of 0.030%).
| Demographics | Rating | Rank | GED/Equivalency |
| Zimbabweans | 99.4 /100 | #52 | Exceptional 88.0% |
| Immigrants | South Africa | 99.4 /100 | #53 | Exceptional 88.0% |
| Soviet Union | 99.4 /100 | #54 | Exceptional 88.0% |
| New Zealanders | 99.4 /100 | #55 | Exceptional 88.0% |
| Immigrants | Denmark | 99.4 /100 | #56 | Exceptional 88.0% |
| Immigrants | Czechoslovakia | 99.3 /100 | #57 | Exceptional 87.9% |
| Northern Europeans | 99.3 /100 | #58 | Exceptional 87.9% |
| Serbians | 99.3 /100 | #59 | Exceptional 87.9% |
| Scandinavians | 99.3 /100 | #60 | Exceptional 87.9% |
| Europeans | 99.3 /100 | #61 | Exceptional 87.9% |
| Germans | 99.3 /100 | #62 | Exceptional 87.9% |
| Immigrants | Turkey | 99.2 /100 | #63 | Exceptional 87.9% |
| Immigrants | Canada | 99.2 /100 | #64 | Exceptional 87.9% |
| Immigrants | North America | 99.1 /100 | #65 | Exceptional 87.8% |
| Immigrants | Bulgaria | 99.1 /100 | #66 | Exceptional 87.8% |