Immigrants from Cuba vs Serbian GED/Equivalency
COMPARE
Immigrants from Cuba
Serbian
GED/Equivalency
GED/Equivalency Comparison
Immigrants from Cuba
Serbians
80.2%
GED/EQUIVALENCY
0.0/ 100
METRIC RATING
320th/ 347
METRIC RANK
87.9%
GED/EQUIVALENCY
99.3/ 100
METRIC RATING
59th/ 347
METRIC RANK
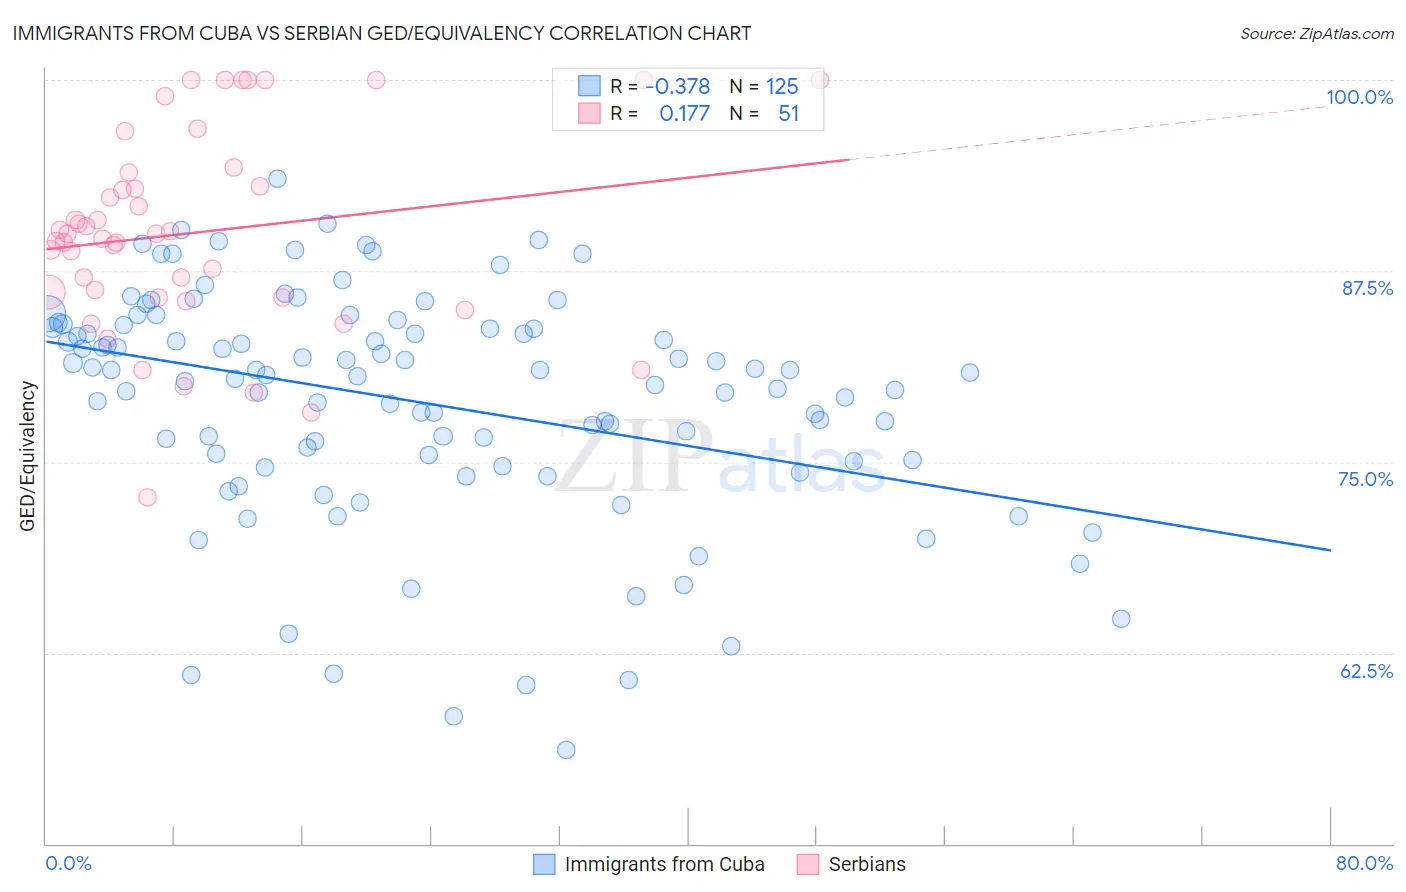
Immigrants from Cuba vs Serbian GED/Equivalency Correlation Chart
The statistical analysis conducted on geographies consisting of 326,030,400 people shows a mild negative correlation between the proportion of Immigrants from Cuba and percentage of population with at least ged/equivalency education in the United States with a correlation coefficient (R) of -0.378 and weighted average of 80.2%. Similarly, the statistical analysis conducted on geographies consisting of 267,642,942 people shows a poor positive correlation between the proportion of Serbians and percentage of population with at least ged/equivalency education in the United States with a correlation coefficient (R) of 0.177 and weighted average of 87.9%, a difference of 9.7%.
GED/Equivalency Correlation Summary
| Measurement | Immigrants from Cuba | Serbian |
| Minimum | 56.2% | 72.6% |
| Maximum | 93.5% | 100.0% |
| Range | 37.3% | 27.4% |
| Mean | 79.0% | 90.0% |
| Median | 80.7% | 89.9% |
| Interquartile 25% (IQ1) | 75.1% | 85.8% |
| Interquartile 75% (IQ3) | 83.9% | 94.0% |
| Interquartile Range (IQR) | 8.8% | 8.2% |
| Standard Deviation (Sample) | 7.5% | 6.5% |
| Standard Deviation (Population) | 7.5% | 6.4% |
Similar Demographics by GED/Equivalency
Demographics Similar to Immigrants from Cuba by GED/Equivalency
In terms of ged/equivalency, the demographic groups most similar to Immigrants from Cuba are Yup'ik (80.0%, a difference of 0.17%), Lumbee (80.0%, a difference of 0.24%), Immigrants from Nicaragua (79.9%, a difference of 0.36%), Yaqui (80.5%, a difference of 0.41%), and Immigrants from Belize (80.5%, a difference of 0.41%).
| Demographics | Rating | Rank | GED/Equivalency |
| Cape Verdeans | 0.0 /100 | #313 | Tragic 80.9% |
| Belizeans | 0.0 /100 | #314 | Tragic 80.9% |
| Apache | 0.0 /100 | #315 | Tragic 80.7% |
| Central American Indians | 0.0 /100 | #316 | Tragic 80.6% |
| Immigrants | Caribbean | 0.0 /100 | #317 | Tragic 80.5% |
| Yaqui | 0.0 /100 | #318 | Tragic 80.5% |
| Immigrants | Belize | 0.0 /100 | #319 | Tragic 80.5% |
| Immigrants | Cuba | 0.0 /100 | #320 | Tragic 80.2% |
| Yup'ik | 0.0 /100 | #321 | Tragic 80.0% |
| Lumbee | 0.0 /100 | #322 | Tragic 80.0% |
| Immigrants | Nicaragua | 0.0 /100 | #323 | Tragic 79.9% |
| Mexican American Indians | 0.0 /100 | #324 | Tragic 79.4% |
| Hondurans | 0.0 /100 | #325 | Tragic 79.3% |
| Yuman | 0.0 /100 | #326 | Tragic 79.2% |
| Central Americans | 0.0 /100 | #327 | Tragic 79.2% |
Demographics Similar to Serbians by GED/Equivalency
In terms of ged/equivalency, the demographic groups most similar to Serbians are Immigrants from Czechoslovakia (87.9%, a difference of 0.010%), Northern European (87.9%, a difference of 0.010%), Scandinavian (87.9%, a difference of 0.010%), European (87.9%, a difference of 0.010%), and German (87.9%, a difference of 0.030%).
| Demographics | Rating | Rank | GED/Equivalency |
| Zimbabweans | 99.4 /100 | #52 | Exceptional 88.0% |
| Immigrants | South Africa | 99.4 /100 | #53 | Exceptional 88.0% |
| Soviet Union | 99.4 /100 | #54 | Exceptional 88.0% |
| New Zealanders | 99.4 /100 | #55 | Exceptional 88.0% |
| Immigrants | Denmark | 99.4 /100 | #56 | Exceptional 88.0% |
| Immigrants | Czechoslovakia | 99.3 /100 | #57 | Exceptional 87.9% |
| Northern Europeans | 99.3 /100 | #58 | Exceptional 87.9% |
| Serbians | 99.3 /100 | #59 | Exceptional 87.9% |
| Scandinavians | 99.3 /100 | #60 | Exceptional 87.9% |
| Europeans | 99.3 /100 | #61 | Exceptional 87.9% |
| Germans | 99.3 /100 | #62 | Exceptional 87.9% |
| Immigrants | Turkey | 99.2 /100 | #63 | Exceptional 87.9% |
| Immigrants | Canada | 99.2 /100 | #64 | Exceptional 87.9% |
| Immigrants | North America | 99.1 /100 | #65 | Exceptional 87.8% |
| Immigrants | Bulgaria | 99.1 /100 | #66 | Exceptional 87.8% |