Immigrants from Taiwan vs Nigerian Associate's Degree
COMPARE
Immigrants from Taiwan
Nigerian
Associate's Degree
Associate's Degree Comparison
Immigrants from Taiwan
Nigerians
58.4%
ASSOCIATE'S DEGREE
100.0/ 100
METRIC RATING
4th/ 347
METRIC RANK
45.1%
ASSOCIATE'S DEGREE
19.1/ 100
METRIC RATING
204th/ 347
METRIC RANK
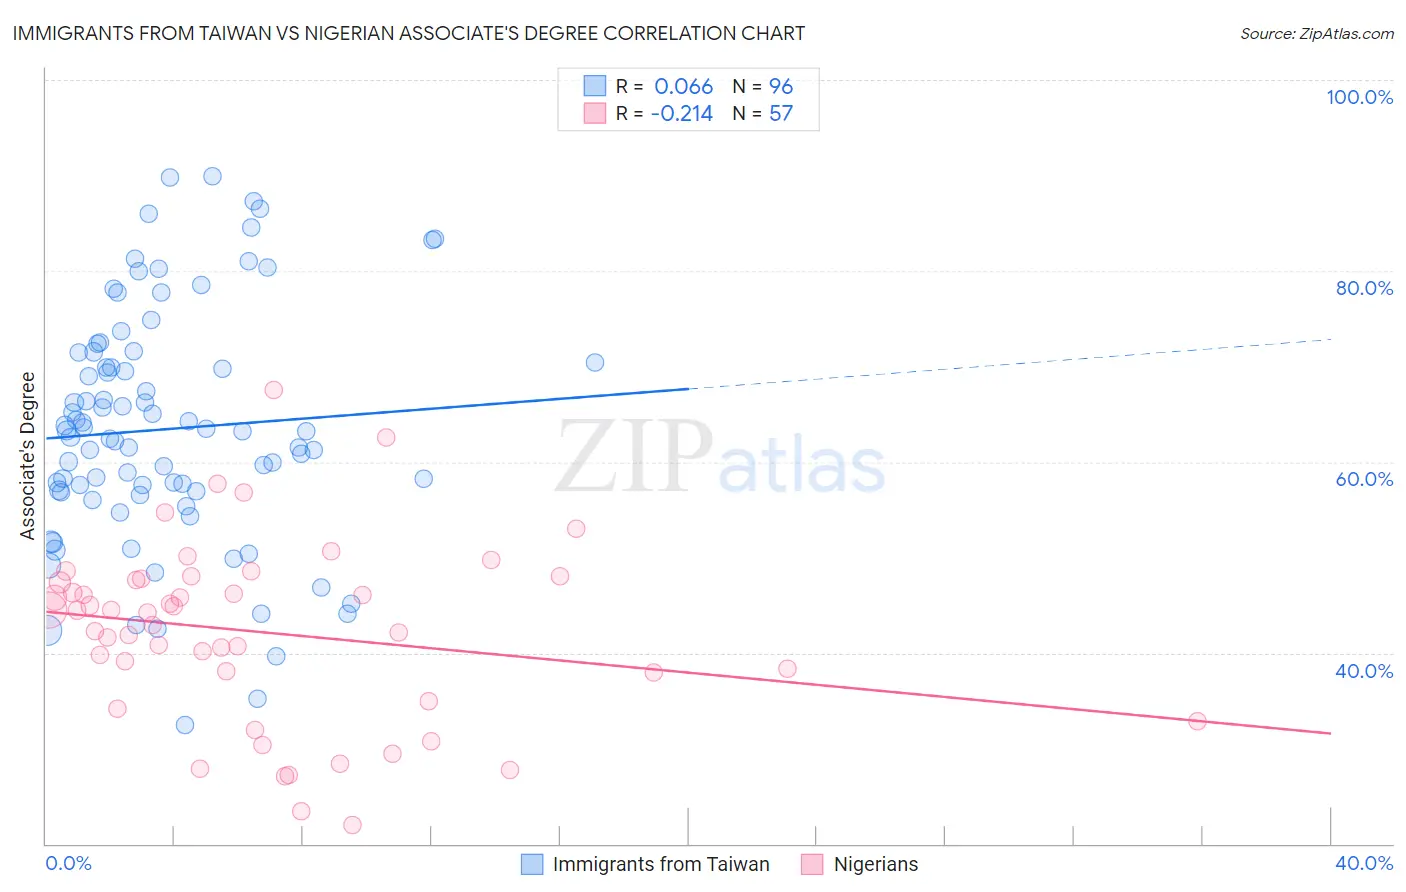
Immigrants from Taiwan vs Nigerian Associate's Degree Correlation Chart
The statistical analysis conducted on geographies consisting of 298,276,858 people shows a slight positive correlation between the proportion of Immigrants from Taiwan and percentage of population with at least associate's degree education in the United States with a correlation coefficient (R) of 0.066 and weighted average of 58.4%. Similarly, the statistical analysis conducted on geographies consisting of 332,751,702 people shows a weak negative correlation between the proportion of Nigerians and percentage of population with at least associate's degree education in the United States with a correlation coefficient (R) of -0.214 and weighted average of 45.1%, a difference of 29.5%.
Associate's Degree Correlation Summary
| Measurement | Immigrants from Taiwan | Nigerian |
| Minimum | 32.5% | 22.0% |
| Maximum | 89.9% | 67.5% |
| Range | 57.4% | 45.6% |
| Mean | 63.4% | 42.1% |
| Median | 63.2% | 44.3% |
| Interquartile 25% (IQ1) | 56.9% | 36.5% |
| Interquartile 75% (IQ3) | 70.9% | 47.7% |
| Interquartile Range (IQR) | 14.0% | 11.2% |
| Standard Deviation (Sample) | 12.4% | 9.4% |
| Standard Deviation (Population) | 12.4% | 9.4% |
Similar Demographics by Associate's Degree
Demographics Similar to Immigrants from Taiwan by Associate's Degree
In terms of associate's degree, the demographic groups most similar to Immigrants from Taiwan are Immigrants from India (58.5%, a difference of 0.25%), Iranian (58.2%, a difference of 0.41%), Immigrants from Singapore (58.9%, a difference of 0.91%), Okinawan (57.7%, a difference of 1.2%), and Immigrants from Iran (57.7%, a difference of 1.3%).
| Demographics | Rating | Rank | Associate's Degree |
| Filipinos | 100.0 /100 | #1 | Exceptional 59.8% |
| Immigrants | Singapore | 100.0 /100 | #2 | Exceptional 58.9% |
| Immigrants | India | 100.0 /100 | #3 | Exceptional 58.5% |
| Immigrants | Taiwan | 100.0 /100 | #4 | Exceptional 58.4% |
| Iranians | 100.0 /100 | #5 | Exceptional 58.2% |
| Okinawans | 100.0 /100 | #6 | Exceptional 57.7% |
| Immigrants | Iran | 100.0 /100 | #7 | Exceptional 57.7% |
| Thais | 100.0 /100 | #8 | Exceptional 57.4% |
| Immigrants | Israel | 100.0 /100 | #9 | Exceptional 56.8% |
| Cypriots | 100.0 /100 | #10 | Exceptional 56.4% |
| Immigrants | Australia | 100.0 /100 | #11 | Exceptional 55.8% |
| Immigrants | South Central Asia | 100.0 /100 | #12 | Exceptional 55.7% |
| Immigrants | China | 100.0 /100 | #13 | Exceptional 55.5% |
| Immigrants | Hong Kong | 100.0 /100 | #14 | Exceptional 55.4% |
| Immigrants | Eastern Asia | 100.0 /100 | #15 | Exceptional 55.4% |
Demographics Similar to Nigerians by Associate's Degree
In terms of associate's degree, the demographic groups most similar to Nigerians are Immigrants from Thailand (45.1%, a difference of 0.020%), German Russian (45.1%, a difference of 0.030%), Panamanian (45.1%, a difference of 0.090%), Immigrants from South Eastern Asia (45.2%, a difference of 0.14%), and Spaniard (45.2%, a difference of 0.16%).
| Demographics | Rating | Rank | Associate's Degree |
| Scotch-Irish | 22.3 /100 | #197 | Fair 45.3% |
| Immigrants | Bangladesh | 21.3 /100 | #198 | Fair 45.2% |
| Immigrants | Senegal | 21.2 /100 | #199 | Fair 45.2% |
| Senegalese | 21.1 /100 | #200 | Fair 45.2% |
| Immigrants | Vietnam | 20.8 /100 | #201 | Fair 45.2% |
| Spaniards | 20.4 /100 | #202 | Fair 45.2% |
| Immigrants | South Eastern Asia | 20.2 /100 | #203 | Fair 45.2% |
| Nigerians | 19.1 /100 | #204 | Poor 45.1% |
| Immigrants | Thailand | 18.9 /100 | #205 | Poor 45.1% |
| German Russians | 18.9 /100 | #206 | Poor 45.1% |
| Panamanians | 18.4 /100 | #207 | Poor 45.1% |
| Dutch | 17.6 /100 | #208 | Poor 45.0% |
| Immigrants | Costa Rica | 16.7 /100 | #209 | Poor 45.0% |
| Immigrants | Philippines | 16.7 /100 | #210 | Poor 45.0% |
| Immigrants | Zaire | 16.6 /100 | #211 | Poor 45.0% |