Immigrants from Norway vs Nigerian Associate's Degree
COMPARE
Immigrants from Norway
Nigerian
Associate's Degree
Associate's Degree Comparison
Immigrants from Norway
Nigerians
52.2%
ASSOCIATE'S DEGREE
99.9/ 100
METRIC RATING
48th/ 347
METRIC RANK
45.1%
ASSOCIATE'S DEGREE
19.1/ 100
METRIC RATING
204th/ 347
METRIC RANK
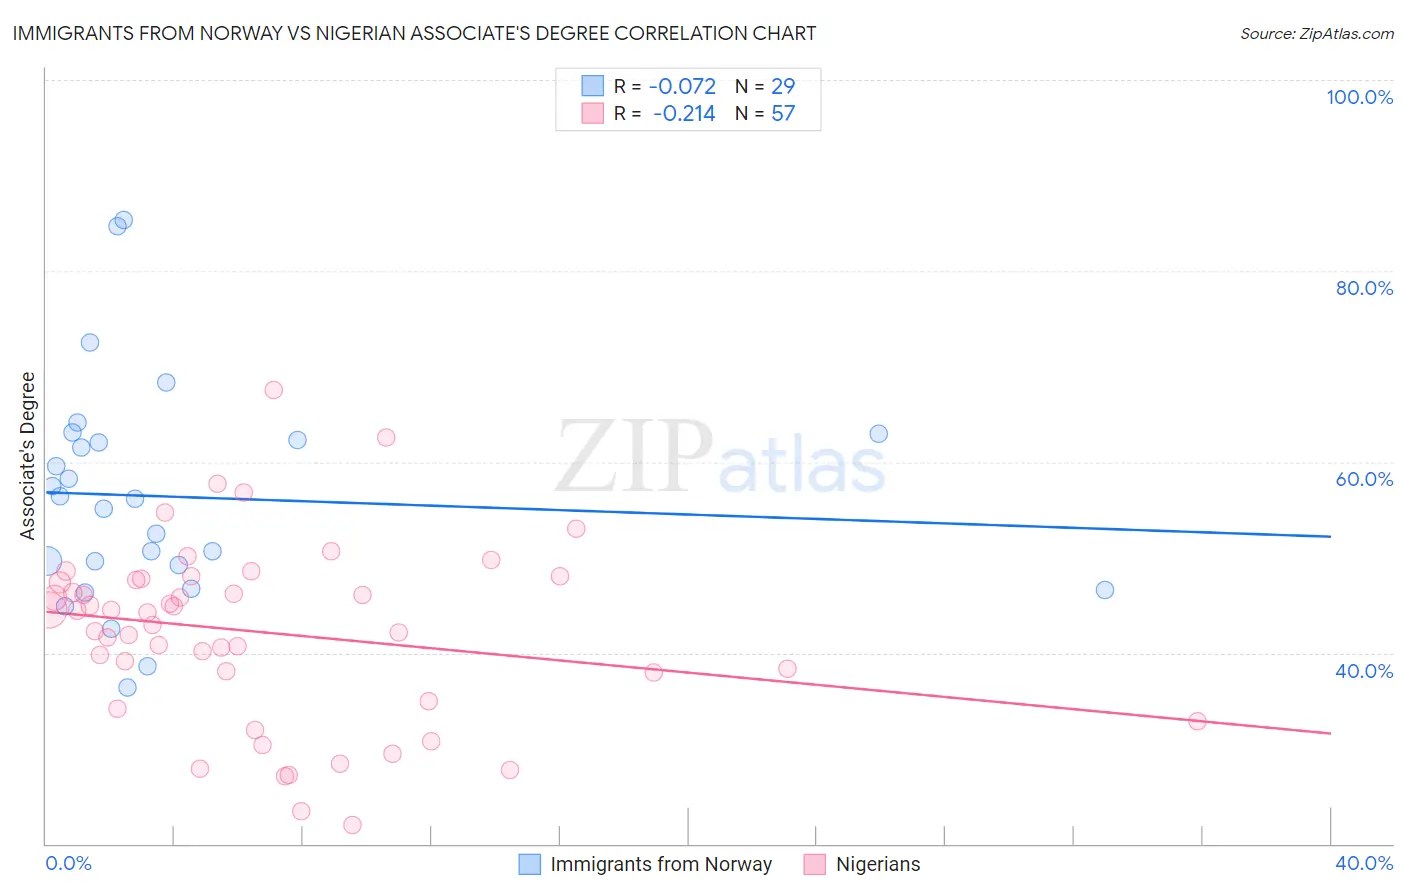
Immigrants from Norway vs Nigerian Associate's Degree Correlation Chart
The statistical analysis conducted on geographies consisting of 116,713,778 people shows a slight negative correlation between the proportion of Immigrants from Norway and percentage of population with at least associate's degree education in the United States with a correlation coefficient (R) of -0.072 and weighted average of 52.2%. Similarly, the statistical analysis conducted on geographies consisting of 332,751,702 people shows a weak negative correlation between the proportion of Nigerians and percentage of population with at least associate's degree education in the United States with a correlation coefficient (R) of -0.214 and weighted average of 45.1%, a difference of 15.8%.
Associate's Degree Correlation Summary
| Measurement | Immigrants from Norway | Nigerian |
| Minimum | 36.3% | 22.0% |
| Maximum | 85.3% | 67.5% |
| Range | 49.0% | 45.6% |
| Mean | 56.3% | 42.1% |
| Median | 56.2% | 44.3% |
| Interquartile 25% (IQ1) | 47.9% | 36.5% |
| Interquartile 75% (IQ3) | 62.6% | 47.7% |
| Interquartile Range (IQR) | 14.7% | 11.2% |
| Standard Deviation (Sample) | 11.7% | 9.4% |
| Standard Deviation (Population) | 11.5% | 9.4% |
Similar Demographics by Associate's Degree
Demographics Similar to Immigrants from Norway by Associate's Degree
In terms of associate's degree, the demographic groups most similar to Immigrants from Norway are Immigrants from Austria (52.1%, a difference of 0.20%), Asian (52.1%, a difference of 0.21%), Immigrants from Kuwait (52.4%, a difference of 0.26%), Immigrants from Bulgaria (52.4%, a difference of 0.27%), and Immigrants from Greece (52.1%, a difference of 0.29%).
| Demographics | Rating | Rank | Associate's Degree |
| Immigrants | Saudi Arabia | 99.9 /100 | #41 | Exceptional 52.6% |
| Immigrants | Malaysia | 99.9 /100 | #42 | Exceptional 52.5% |
| Immigrants | South Africa | 99.9 /100 | #43 | Exceptional 52.5% |
| Estonians | 99.9 /100 | #44 | Exceptional 52.5% |
| Immigrants | Lithuania | 99.9 /100 | #45 | Exceptional 52.4% |
| Immigrants | Bulgaria | 99.9 /100 | #46 | Exceptional 52.4% |
| Immigrants | Kuwait | 99.9 /100 | #47 | Exceptional 52.4% |
| Immigrants | Norway | 99.9 /100 | #48 | Exceptional 52.2% |
| Immigrants | Austria | 99.9 /100 | #49 | Exceptional 52.1% |
| Asians | 99.9 /100 | #50 | Exceptional 52.1% |
| Immigrants | Greece | 99.9 /100 | #51 | Exceptional 52.1% |
| Bolivians | 99.8 /100 | #52 | Exceptional 52.0% |
| Immigrants | Asia | 99.8 /100 | #53 | Exceptional 52.0% |
| Immigrants | Spain | 99.8 /100 | #54 | Exceptional 51.9% |
| Australians | 99.8 /100 | #55 | Exceptional 51.9% |
Demographics Similar to Nigerians by Associate's Degree
In terms of associate's degree, the demographic groups most similar to Nigerians are Immigrants from Thailand (45.1%, a difference of 0.020%), German Russian (45.1%, a difference of 0.030%), Panamanian (45.1%, a difference of 0.090%), Immigrants from South Eastern Asia (45.2%, a difference of 0.14%), and Spaniard (45.2%, a difference of 0.16%).
| Demographics | Rating | Rank | Associate's Degree |
| Scotch-Irish | 22.3 /100 | #197 | Fair 45.3% |
| Immigrants | Bangladesh | 21.3 /100 | #198 | Fair 45.2% |
| Immigrants | Senegal | 21.2 /100 | #199 | Fair 45.2% |
| Senegalese | 21.1 /100 | #200 | Fair 45.2% |
| Immigrants | Vietnam | 20.8 /100 | #201 | Fair 45.2% |
| Spaniards | 20.4 /100 | #202 | Fair 45.2% |
| Immigrants | South Eastern Asia | 20.2 /100 | #203 | Fair 45.2% |
| Nigerians | 19.1 /100 | #204 | Poor 45.1% |
| Immigrants | Thailand | 18.9 /100 | #205 | Poor 45.1% |
| German Russians | 18.9 /100 | #206 | Poor 45.1% |
| Panamanians | 18.4 /100 | #207 | Poor 45.1% |
| Dutch | 17.6 /100 | #208 | Poor 45.0% |
| Immigrants | Costa Rica | 16.7 /100 | #209 | Poor 45.0% |
| Immigrants | Philippines | 16.7 /100 | #210 | Poor 45.0% |
| Immigrants | Zaire | 16.6 /100 | #211 | Poor 45.0% |