Vietnamese vs Immigrants from Venezuela Professional Degree

COMPARE

Vietnamese
Race
Ancestry
AfghanAfricanAlaska NativeAlaskan AthabascanAlbanianAleutAlsatianAmericanApacheArabArapahoArgentineanArmenianAssyrian/Chaldean/SyriacAustralianAustrianBahamianBangladeshiBarbadianBasqueBelgianBelizeanBermudanBhutaneseBlackfeetBolivianBrazilianBritishBritish West IndianBulgarianBurmeseCajunCambodianCanadianCape VerdeanCarpatho RusynCelticCentral AmericanCentral American IndianCherokeeCheyenneChickasawChileanChineseChippewaChoctawColombianColvilleComancheCosta RicanCreeCreekCroatianCrowCubanCypriotCzechCzechoslovakianDanishDelawareDominicanDutchDutch West IndianEastern EuropeanEcuadorianEgyptianEnglishEstonianEthiopianEuropeanFijianFilipinoFinnishFrenchFrench American IndianFrench CanadianGermanGerman RussianGhanaianGreekGuamanian/ChamorroGuatemalanGuyaneseHaitianHmongHonduranHopiHoumaHungarianIcelanderIndian (Asian)IndonesianInupiatIranianIraqiIrishIroquoisIsraeliItalianJamaicanJapaneseJordanianKenyanKiowaKoreanLaotianLatvianLebaneseLiberianLithuanianLumbeeLuxembourgerMacedonianMalaysianMalteseMarshalleseMenomineeMexicanMexican American IndianMongolianMoroccanNative HawaiianNavajoNepaleseNew ZealanderNicaraguanNigerianNorthern EuropeanNorwegianOkinawanOsageOttawaPaiutePakistaniPalestinianPanamanianParaguayanPennsylvania GermanPeruvianPimaPolishPortuguesePotawatomiPuebloPuerto RicanPuget Sound SalishRomanianRussianSalvadoranSamoanScandinavianScotch-IrishScottishSeminoleSenegaleseSerbianShoshoneSierra LeoneanSiouxSlavicSlovakSloveneSomaliSouth AfricanSouth AmericanSouth American IndianSoviet UnionSpaniardSpanishSpanish AmericanSpanish American IndianSri LankanSubsaharan AfricanSudaneseSwedishSwissSyrianTaiwaneseThaiTlingit-HaidaTohono O'OdhamTonganTrinidadian and TobagonianTsimshianTurkishU.S. Virgin IslanderUgandanUkrainianUruguayanUteVenezuelanVietnameseWelshWest IndianYakamaYaquiYugoslavianYumanYup'ikZimbabwean
Immigration
NonimmigrantsImmigrantsAfghanistanAfricaAlbaniaArgentinaArmeniaAsiaAustraliaAustriaBahamasBangladeshBarbadosBelarusBelgiumBelizeBoliviaBosnia and HerzegovinaBrazilBulgariaBurma/MyanmarCabo VerdeCambodiaCameroonCanadaCaribbeanCentral AmericaChileChinaColombiaCongoCosta RicaCroatiaCubaCzechoslovakiaDenmarkDominicaDominican RepublicEastern AfricaEastern AsiaEastern EuropeEcuadorEgyptEl SalvadorEnglandEritreaEthiopiaEuropeFijiFranceGermanyGhanaGreeceGrenadaGuatemalaGuyanaHaitiHondurasHong KongHungaryIndiaIndonesiaIranIraqIrelandIsraelItalyJamaicaJapanJordanKazakhstanKenyaKoreaKuwaitLaosLatin AmericaLatviaLebanonLiberiaLithuaniaMalaysiaMexicoMicronesiaMiddle AfricaMoldovaMoroccoNepalNetherlandsNicaraguaNigeriaNorth AmericaNorth MacedoniaNorthern AfricaNorthern EuropeNorwayOceaniaPakistanPanamaPeruPhilippinesPolandPortugalRomaniaRussiaSaudi ArabiaScotlandSenegalSerbiaSierra LeoneSingaporeSomaliaSouth AfricaSouth AmericaSouth Central AsiaSouth Eastern AsiaSouthern EuropeSpainSri LankaSt. Vincent and the GrenadinesSudanSwedenSwitzerlandSyriaTaiwanThailandTrinidad and TobagoTurkeyUgandaUkraineUruguayUzbekistanVietnamWest IndiesWestern AfricaWestern AsiaWestern EuropeYemenZaireZimbabweAzores
Immigrants from Venezuela
Race
Ancestry
AfghanAfricanAlaska NativeAlaskan AthabascanAlbanianAleutAlsatianAmericanApacheArabArapahoArgentineanArmenianAssyrian/Chaldean/SyriacAustralianAustrianBahamianBangladeshiBarbadianBasqueBelgianBelizeanBermudanBhutaneseBlackfeetBolivianBrazilianBritishBritish West IndianBulgarianBurmeseCajunCambodianCanadianCape VerdeanCarpatho RusynCelticCentral AmericanCentral American IndianCherokeeCheyenneChickasawChileanChineseChippewaChoctawColombianColvilleComancheCosta RicanCreeCreekCroatianCrowCubanCypriotCzechCzechoslovakianDanishDelawareDominicanDutchDutch West IndianEastern EuropeanEcuadorianEgyptianEnglishEstonianEthiopianEuropeanFijianFilipinoFinnishFrenchFrench American IndianFrench CanadianGermanGerman RussianGhanaianGreekGuamanian/ChamorroGuatemalanGuyaneseHaitianHmongHonduranHopiHoumaHungarianIcelanderIndian (Asian)IndonesianInupiatIranianIraqiIrishIroquoisIsraeliItalianJamaicanJapaneseJordanianKenyanKiowaKoreanLaotianLatvianLebaneseLiberianLithuanianLumbeeLuxembourgerMacedonianMalaysianMalteseMarshalleseMenomineeMexicanMexican American IndianMongolianMoroccanNative HawaiianNavajoNepaleseNew ZealanderNicaraguanNigerianNorthern EuropeanNorwegianOkinawanOsageOttawaPaiutePakistaniPalestinianPanamanianParaguayanPennsylvania GermanPeruvianPimaPolishPortuguesePotawatomiPuebloPuerto RicanPuget Sound SalishRomanianRussianSalvadoranSamoanScandinavianScotch-IrishScottishSeminoleSenegaleseSerbianShoshoneSierra LeoneanSiouxSlavicSlovakSloveneSomaliSouth AfricanSouth AmericanSouth American IndianSoviet UnionSpaniardSpanishSpanish AmericanSpanish American IndianSri LankanSubsaharan AfricanSudaneseSwedishSwissSyrianTaiwaneseThaiTlingit-HaidaTohono O'OdhamTonganTrinidadian and TobagonianTsimshianTurkishU.S. Virgin IslanderUgandanUkrainianUruguayanUteVenezuelanWelshWest IndianYakamaYaquiYugoslavianYumanYup'ikZimbabwean
Immigration
NonimmigrantsImmigrantsAfghanistanAfricaAlbaniaArgentinaArmeniaAsiaAustraliaAustriaBahamasBangladeshBarbadosBelarusBelgiumBelizeBoliviaBosnia and HerzegovinaBrazilBulgariaBurma/MyanmarCabo VerdeCambodiaCameroonCanadaCaribbeanCentral AmericaChileChinaColombiaCongoCosta RicaCroatiaCubaCzechoslovakiaDenmarkDominicaDominican RepublicEastern AfricaEastern AsiaEastern EuropeEcuadorEgyptEl SalvadorEnglandEritreaEthiopiaEuropeFijiFranceGermanyGhanaGreeceGrenadaGuatemalaGuyanaHaitiHondurasHong KongHungaryIndiaIndonesiaIranIraqIrelandIsraelItalyJamaicaJapanJordanKazakhstanKenyaKoreaKuwaitLaosLatin AmericaLatviaLebanonLiberiaLithuaniaMalaysiaMexicoMicronesiaMiddle AfricaMoldovaMoroccoNepalNetherlandsNicaraguaNigeriaNorth AmericaNorth MacedoniaNorthern AfricaNorthern EuropeNorwayOceaniaPakistanPanamaPeruPhilippinesPolandPortugalRomaniaRussiaSaudi ArabiaScotlandSenegalSerbiaSierra LeoneSingaporeSomaliaSouth AfricaSouth AmericaSouth Central AsiaSouth Eastern AsiaSouthern EuropeSpainSri LankaSt. Vincent and the GrenadinesSudanSwedenSwitzerlandSyriaTaiwanThailandTrinidad and TobagoTurkeyUgandaUkraineUruguayUzbekistanVenezuelaVietnamWest IndiesWestern AfricaWestern AsiaWestern EuropeYemenZaireZimbabweAzores
Professional Degree
Income
Poverty
Unemployment
Labor Participation
Family Structure
Vehicle Availability
Education Level
Disability

Professional Degree Comparison

Vietnamese

Immigrants from Venezuela

Good
Exceptional
4.5%
PROFESSIONAL DEGREE
68.4/ 100
METRIC RATING
159th/ 347
METRIC RANK
4.8%
PROFESSIONAL DEGREE
93.8/ 100
METRIC RATING
123rd/ 347
METRIC RANK

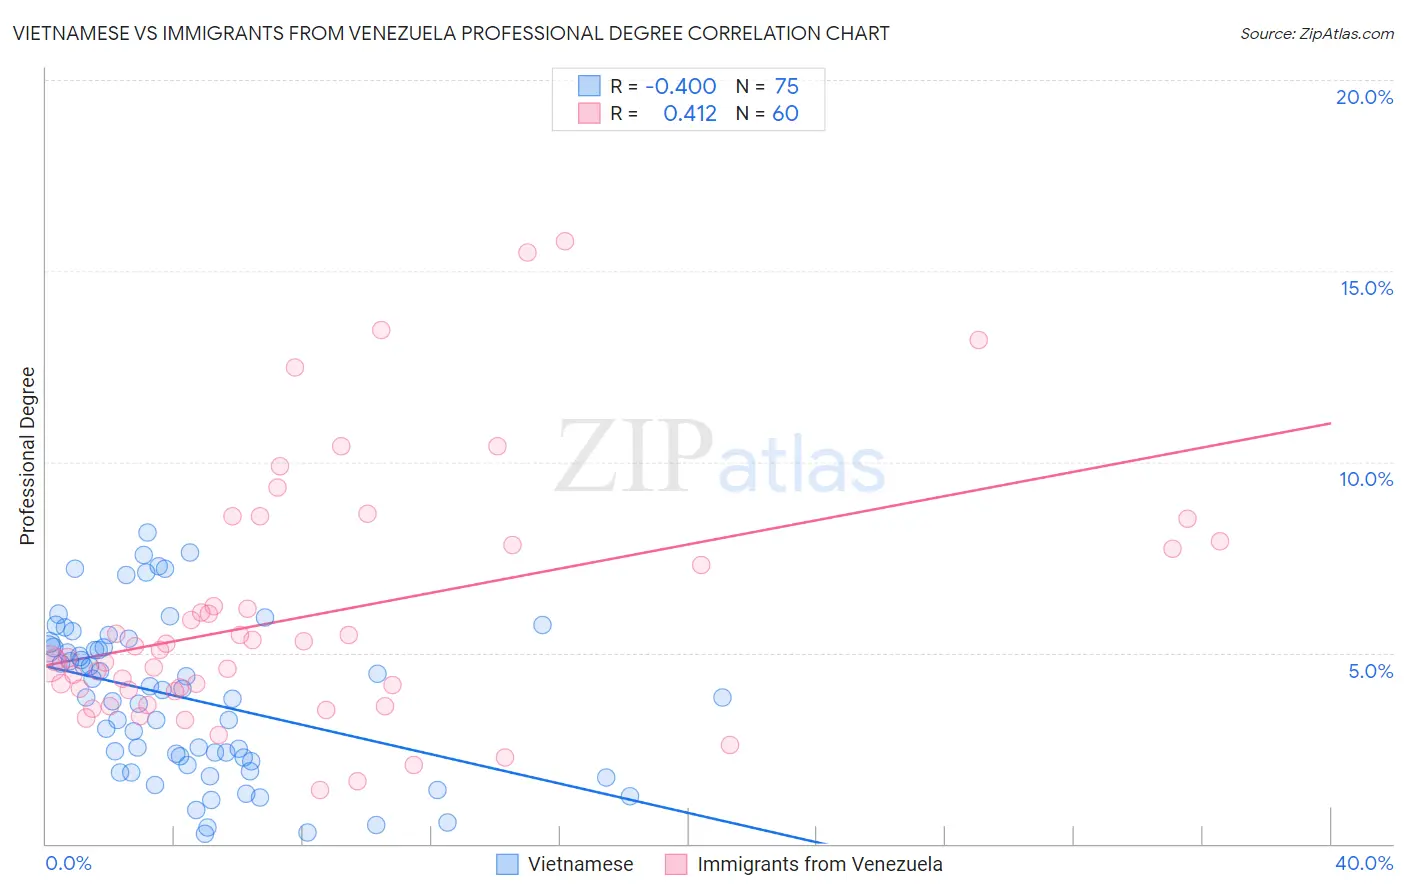
Vietnamese vs Immigrants from Venezuela Professional Degree Correlation Chart

The statistical analysis conducted on geographies consisting of 170,674,020 people shows a moderate negative correlation between the proportion of Vietnamese and percentage of population with at least professional degree education in the United States with a correlation coefficient (R) of -0.400 and weighted average of 4.5%. Similarly, the statistical analysis conducted on geographies consisting of 287,618,886 people shows a moderate positive correlation between the proportion of Immigrants from Venezuela and percentage of population with at least professional degree education in the United States with a correlation coefficient (R) of 0.412 and weighted average of 4.8%, a difference of 6.9%.
Vietnamese vs Immigrants from Venezuela Professional Degree

Professional Degree Correlation Summary

MeasurementVietnameseImmigrants from Venezuela
Minimum0.26%1.4%
Maximum8.1%15.8%
Range7.9%14.4%
Mean3.8%6.0%
Median3.8%5.0%
Interquartile 25% (IQ1)2.2%4.0%
Interquartile 75% (IQ3)5.1%7.8%
Interquartile Range (IQR)3.0%3.8%
Standard Deviation (Sample)2.0%3.3%
Standard Deviation (Population)2.0%3.2%

Similar Demographics by Professional Degree

Demographics Similar to Vietnamese by Professional Degree

In terms of professional degree, the demographic groups most similar to Vietnamese are Immigrants from Senegal (4.5%, a difference of 0.060%), Immigrants from Armenia (4.5%, a difference of 0.080%), Assyrian/Chaldean/Syriac (4.5%, a difference of 0.16%), Iraqi (4.5%, a difference of 0.24%), and Swedish (4.5%, a difference of 0.26%).
DemographicsRating | RankProfessional Degree
Immigrants | Africa
72.5
/100
|
#152
Good
4.6%
Immigrants | Uruguay
72.5
/100
|
#153
Good
4.6%
Scottish
71.8
/100
|
#154
Good
4.6%
Slavs
70.8
/100
|
#155
Good
4.5%
Swedes
69.9
/100
|
#156
Good
4.5%
Iraqis
69.8
/100
|
#157
Good
4.5%
Immigrants | Armenia
68.8
/100
|
#158
Good
4.5%
Vietnamese
68.4
/100
|
#159
Good
4.5%
Immigrants | Senegal
68.0
/100
|
#160
Good
4.5%
Assyrians/Chaldeans/Syriacs
67.4
/100
|
#161
Good
4.5%
Peruvians
65.2
/100
|
#162
Good
4.5%
Sierra Leoneans
64.3
/100
|
#163
Good
4.5%
Swiss
61.0
/100
|
#164
Good
4.5%
Costa Ricans
59.9
/100
|
#165
Average
4.5%
Immigrants | Colombia
59.4
/100
|
#166
Average
4.5%

Demographics Similar to Immigrants from Venezuela by Professional Degree

In terms of professional degree, the demographic groups most similar to Immigrants from Venezuela are Immigrants from Germany (4.9%, a difference of 0.17%), Immigrants from Eritrea (4.8%, a difference of 0.18%), Immigrants from Albania (4.8%, a difference of 0.31%), European (4.8%, a difference of 0.36%), and Immigrants from Moldova (4.9%, a difference of 0.63%).
DemographicsRating | RankProfessional Degree
Venezuelans
96.3
/100
|
#116
Exceptional
4.9%
Immigrants | Syria
96.0
/100
|
#117
Exceptional
4.9%
Croatians
96.0
/100
|
#118
Exceptional
4.9%
Immigrants | Sudan
95.4
/100
|
#119
Exceptional
4.9%
Albanians
95.3
/100
|
#120
Exceptional
4.9%
Immigrants | Moldova
94.8
/100
|
#121
Exceptional
4.9%
Immigrants | Germany
94.1
/100
|
#122
Exceptional
4.9%
Immigrants | Venezuela
93.8
/100
|
#123
Exceptional
4.8%
Immigrants | Eritrea
93.5
/100
|
#124
Exceptional
4.8%
Immigrants | Albania
93.3
/100
|
#125
Exceptional
4.8%
Europeans
93.2
/100
|
#126
Exceptional
4.8%
Serbians
92.6
/100
|
#127
Exceptional
4.8%
Immigrants | Eastern Africa
92.5
/100
|
#128
Exceptional
4.8%
Palestinians
91.5
/100
|
#129
Exceptional
4.8%
Icelanders
91.5
/100
|
#130
Exceptional
4.8%