Vietnamese vs Immigrants from Western Europe Professional Degree

COMPARE

Vietnamese
Race
Ancestry
AfghanAfricanAlaska NativeAlaskan AthabascanAlbanianAleutAlsatianAmericanApacheArabArapahoArgentineanArmenianAssyrian/Chaldean/SyriacAustralianAustrianBahamianBangladeshiBarbadianBasqueBelgianBelizeanBermudanBhutaneseBlackfeetBolivianBrazilianBritishBritish West IndianBulgarianBurmeseCajunCambodianCanadianCape VerdeanCarpatho RusynCelticCentral AmericanCentral American IndianCherokeeCheyenneChickasawChileanChineseChippewaChoctawColombianColvilleComancheCosta RicanCreeCreekCroatianCrowCubanCypriotCzechCzechoslovakianDanishDelawareDominicanDutchDutch West IndianEastern EuropeanEcuadorianEgyptianEnglishEstonianEthiopianEuropeanFijianFilipinoFinnishFrenchFrench American IndianFrench CanadianGermanGerman RussianGhanaianGreekGuamanian/ChamorroGuatemalanGuyaneseHaitianHmongHonduranHopiHoumaHungarianIcelanderIndian (Asian)IndonesianInupiatIranianIraqiIrishIroquoisIsraeliItalianJamaicanJapaneseJordanianKenyanKiowaKoreanLaotianLatvianLebaneseLiberianLithuanianLumbeeLuxembourgerMacedonianMalaysianMalteseMarshalleseMenomineeMexicanMexican American IndianMongolianMoroccanNative HawaiianNavajoNepaleseNew ZealanderNicaraguanNigerianNorthern EuropeanNorwegianOkinawanOsageOttawaPaiutePakistaniPalestinianPanamanianParaguayanPennsylvania GermanPeruvianPimaPolishPortuguesePotawatomiPuebloPuerto RicanPuget Sound SalishRomanianRussianSalvadoranSamoanScandinavianScotch-IrishScottishSeminoleSenegaleseSerbianShoshoneSierra LeoneanSiouxSlavicSlovakSloveneSomaliSouth AfricanSouth AmericanSouth American IndianSoviet UnionSpaniardSpanishSpanish AmericanSpanish American IndianSri LankanSubsaharan AfricanSudaneseSwedishSwissSyrianTaiwaneseThaiTlingit-HaidaTohono O'OdhamTonganTrinidadian and TobagonianTsimshianTurkishU.S. Virgin IslanderUgandanUkrainianUruguayanUteVenezuelanVietnameseWelshWest IndianYakamaYaquiYugoslavianYumanYup'ikZimbabwean
Immigration
NonimmigrantsImmigrantsAfghanistanAfricaAlbaniaArgentinaArmeniaAsiaAustraliaAustriaBahamasBangladeshBarbadosBelarusBelgiumBelizeBoliviaBosnia and HerzegovinaBrazilBulgariaBurma/MyanmarCabo VerdeCambodiaCameroonCanadaCaribbeanCentral AmericaChileChinaColombiaCongoCosta RicaCroatiaCubaCzechoslovakiaDenmarkDominicaDominican RepublicEastern AfricaEastern AsiaEastern EuropeEcuadorEgyptEl SalvadorEnglandEritreaEthiopiaEuropeFijiFranceGermanyGhanaGreeceGrenadaGuatemalaGuyanaHaitiHondurasHong KongHungaryIndiaIndonesiaIranIraqIrelandIsraelItalyJamaicaJapanJordanKazakhstanKenyaKoreaKuwaitLaosLatin AmericaLatviaLebanonLiberiaLithuaniaMalaysiaMexicoMicronesiaMiddle AfricaMoldovaMoroccoNepalNetherlandsNicaraguaNigeriaNorth AmericaNorth MacedoniaNorthern AfricaNorthern EuropeNorwayOceaniaPakistanPanamaPeruPhilippinesPolandPortugalRomaniaRussiaSaudi ArabiaScotlandSenegalSerbiaSierra LeoneSingaporeSomaliaSouth AfricaSouth AmericaSouth Central AsiaSouth Eastern AsiaSouthern EuropeSpainSri LankaSt. Vincent and the GrenadinesSudanSwedenSwitzerlandSyriaTaiwanThailandTrinidad and TobagoTurkeyUgandaUkraineUruguayUzbekistanVenezuelaVietnamWest IndiesWestern AfricaWestern AsiaYemenZaireZimbabweAzores
Immigrants from Western Europe
Race
Ancestry
AfghanAfricanAlaska NativeAlaskan AthabascanAlbanianAleutAlsatianAmericanApacheArabArapahoArgentineanArmenianAssyrian/Chaldean/SyriacAustralianAustrianBahamianBangladeshiBarbadianBasqueBelgianBelizeanBermudanBhutaneseBlackfeetBolivianBrazilianBritishBritish West IndianBulgarianBurmeseCajunCambodianCanadianCape VerdeanCarpatho RusynCelticCentral AmericanCentral American IndianCherokeeCheyenneChickasawChileanChineseChippewaChoctawColombianColvilleComancheCosta RicanCreeCreekCroatianCrowCubanCypriotCzechCzechoslovakianDanishDelawareDominicanDutchDutch West IndianEastern EuropeanEcuadorianEgyptianEnglishEstonianEthiopianEuropeanFijianFilipinoFinnishFrenchFrench American IndianFrench CanadianGermanGerman RussianGhanaianGreekGuamanian/ChamorroGuatemalanGuyaneseHaitianHmongHonduranHopiHoumaHungarianIcelanderIndian (Asian)IndonesianInupiatIranianIraqiIrishIroquoisIsraeliItalianJamaicanJapaneseJordanianKenyanKiowaKoreanLaotianLatvianLebaneseLiberianLithuanianLumbeeLuxembourgerMacedonianMalaysianMalteseMarshalleseMenomineeMexicanMexican American IndianMongolianMoroccanNative HawaiianNavajoNepaleseNew ZealanderNicaraguanNigerianNorthern EuropeanNorwegianOkinawanOsageOttawaPaiutePakistaniPalestinianPanamanianParaguayanPennsylvania GermanPeruvianPimaPolishPortuguesePotawatomiPuebloPuerto RicanPuget Sound SalishRomanianRussianSalvadoranSamoanScandinavianScotch-IrishScottishSeminoleSenegaleseSerbianShoshoneSierra LeoneanSiouxSlavicSlovakSloveneSomaliSouth AfricanSouth AmericanSouth American IndianSoviet UnionSpaniardSpanishSpanish AmericanSpanish American IndianSri LankanSubsaharan AfricanSudaneseSwedishSwissSyrianTaiwaneseThaiTlingit-HaidaTohono O'OdhamTonganTrinidadian and TobagonianTsimshianTurkishU.S. Virgin IslanderUgandanUkrainianUruguayanUteVenezuelanWelshWest IndianYakamaYaquiYugoslavianYumanYup'ikZimbabwean
Immigration
NonimmigrantsImmigrantsAfghanistanAfricaAlbaniaArgentinaArmeniaAsiaAustraliaAustriaBahamasBangladeshBarbadosBelarusBelgiumBelizeBoliviaBosnia and HerzegovinaBrazilBulgariaBurma/MyanmarCabo VerdeCambodiaCameroonCanadaCaribbeanCentral AmericaChileChinaColombiaCongoCosta RicaCroatiaCubaCzechoslovakiaDenmarkDominicaDominican RepublicEastern AfricaEastern AsiaEastern EuropeEcuadorEgyptEl SalvadorEnglandEritreaEthiopiaEuropeFijiFranceGermanyGhanaGreeceGrenadaGuatemalaGuyanaHaitiHondurasHong KongHungaryIndiaIndonesiaIranIraqIrelandIsraelItalyJamaicaJapanJordanKazakhstanKenyaKoreaKuwaitLaosLatin AmericaLatviaLebanonLiberiaLithuaniaMalaysiaMexicoMicronesiaMiddle AfricaMoldovaMoroccoNepalNetherlandsNicaraguaNigeriaNorth AmericaNorth MacedoniaNorthern AfricaNorthern EuropeNorwayOceaniaPakistanPanamaPeruPhilippinesPolandPortugalRomaniaRussiaSaudi ArabiaScotlandSenegalSerbiaSierra LeoneSingaporeSomaliaSouth AfricaSouth AmericaSouth Central AsiaSouth Eastern AsiaSouthern EuropeSpainSri LankaSt. Vincent and the GrenadinesSudanSwedenSwitzerlandSyriaTaiwanThailandTrinidad and TobagoTurkeyUgandaUkraineUruguayUzbekistanVenezuelaVietnamWest IndiesWestern AfricaWestern AsiaWestern EuropeYemenZaireZimbabweAzores
Professional Degree
Income
Poverty
Unemployment
Labor Participation
Family Structure
Vehicle Availability
Education Level
Disability

Professional Degree Comparison

Vietnamese

Immigrants from Western Europe

Good
Exceptional
4.5%
PROFESSIONAL DEGREE
68.4/ 100
METRIC RATING
159th/ 347
METRIC RANK
5.7%
PROFESSIONAL DEGREE
100.0/ 100
METRIC RATING
55th/ 347
METRIC RANK

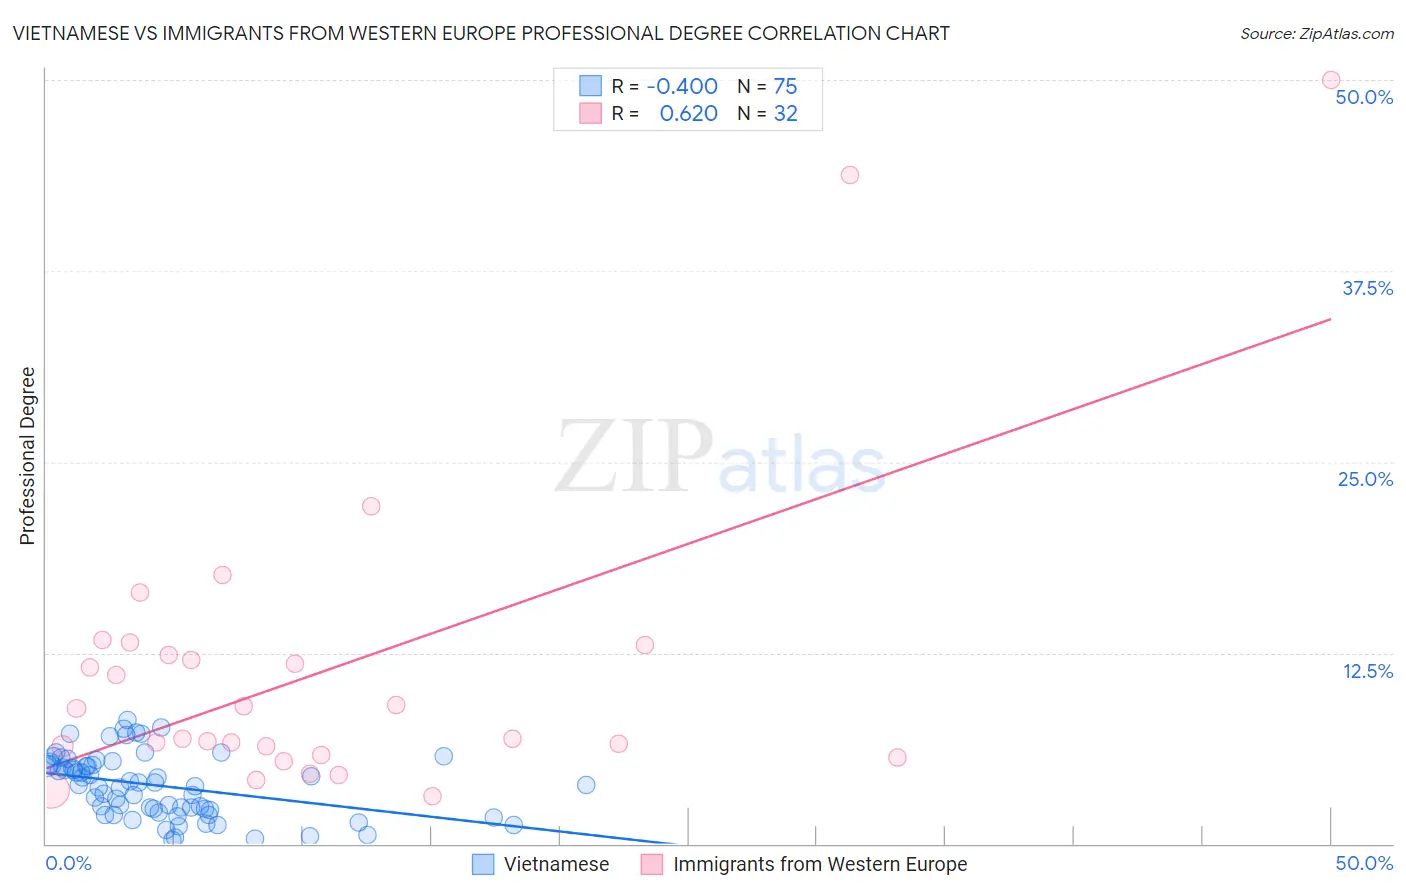
Vietnamese vs Immigrants from Western Europe Professional Degree Correlation Chart

The statistical analysis conducted on geographies consisting of 170,674,020 people shows a moderate negative correlation between the proportion of Vietnamese and percentage of population with at least professional degree education in the United States with a correlation coefficient (R) of -0.400 and weighted average of 4.5%. Similarly, the statistical analysis conducted on geographies consisting of 492,121,721 people shows a significant positive correlation between the proportion of Immigrants from Western Europe and percentage of population with at least professional degree education in the United States with a correlation coefficient (R) of 0.620 and weighted average of 5.7%, a difference of 26.3%.
Vietnamese vs Immigrants from Western Europe Professional Degree

Professional Degree Correlation Summary

MeasurementVietnameseImmigrants from Western Europe
Minimum0.26%3.1%
Maximum8.1%50.0%
Range7.9%46.9%
Mean3.8%11.4%
Median3.8%7.9%
Interquartile 25% (IQ1)2.2%6.1%
Interquartile 75% (IQ3)5.1%12.7%
Interquartile Range (IQR)3.0%6.6%
Standard Deviation (Sample)2.0%10.3%
Standard Deviation (Population)2.0%10.2%

Similar Demographics by Professional Degree

Demographics Similar to Vietnamese by Professional Degree

In terms of professional degree, the demographic groups most similar to Vietnamese are Immigrants from Senegal (4.5%, a difference of 0.060%), Immigrants from Armenia (4.5%, a difference of 0.080%), Assyrian/Chaldean/Syriac (4.5%, a difference of 0.16%), Iraqi (4.5%, a difference of 0.24%), and Swedish (4.5%, a difference of 0.26%).
DemographicsRating | RankProfessional Degree
Immigrants | Africa
72.5
/100
|
#152
Good
4.6%
Immigrants | Uruguay
72.5
/100
|
#153
Good
4.6%
Scottish
71.8
/100
|
#154
Good
4.6%
Slavs
70.8
/100
|
#155
Good
4.5%
Swedes
69.9
/100
|
#156
Good
4.5%
Iraqis
69.8
/100
|
#157
Good
4.5%
Immigrants | Armenia
68.8
/100
|
#158
Good
4.5%
Vietnamese
68.4
/100
|
#159
Good
4.5%
Immigrants | Senegal
68.0
/100
|
#160
Good
4.5%
Assyrians/Chaldeans/Syriacs
67.4
/100
|
#161
Good
4.5%
Peruvians
65.2
/100
|
#162
Good
4.5%
Sierra Leoneans
64.3
/100
|
#163
Good
4.5%
Swiss
61.0
/100
|
#164
Good
4.5%
Costa Ricans
59.9
/100
|
#165
Average
4.5%
Immigrants | Colombia
59.4
/100
|
#166
Average
4.5%

Demographics Similar to Immigrants from Western Europe by Professional Degree

In terms of professional degree, the demographic groups most similar to Immigrants from Western Europe are Immigrants from Malaysia (5.7%, a difference of 0.12%), South African (5.7%, a difference of 0.38%), Immigrants from Kuwait (5.7%, a difference of 0.40%), Bulgarian (5.7%, a difference of 0.98%), and Immigrants from Netherlands (5.8%, a difference of 1.4%).
DemographicsRating | RankProfessional Degree
Paraguayans
100.0
/100
|
#48
Exceptional
5.9%
Immigrants | Latvia
100.0
/100
|
#49
Exceptional
5.8%
Immigrants | Czechoslovakia
100.0
/100
|
#50
Exceptional
5.8%
Immigrants | Greece
100.0
/100
|
#51
Exceptional
5.8%
Immigrants | Serbia
100.0
/100
|
#52
Exceptional
5.8%
Immigrants | Netherlands
100.0
/100
|
#53
Exceptional
5.8%
Immigrants | Kuwait
100.0
/100
|
#54
Exceptional
5.7%
Immigrants | Western Europe
100.0
/100
|
#55
Exceptional
5.7%
Immigrants | Malaysia
100.0
/100
|
#56
Exceptional
5.7%
South Africans
100.0
/100
|
#57
Exceptional
5.7%
Bulgarians
100.0
/100
|
#58
Exceptional
5.7%
Immigrants | Europe
100.0
/100
|
#59
Exceptional
5.6%
Bolivians
99.9
/100
|
#60
Exceptional
5.6%
Immigrants | Lithuania
99.9
/100
|
#61
Exceptional
5.6%
Immigrants | Belarus
99.9
/100
|
#62
Exceptional
5.5%