Vietnamese vs Slovak Professional Degree
COMPARE
Vietnamese
Slovak
Professional Degree
Professional Degree Comparison
Vietnamese
Slovaks
4.5%
PROFESSIONAL DEGREE
68.4/ 100
METRIC RATING
159th/ 347
METRIC RANK
4.3%
PROFESSIONAL DEGREE
30.7/ 100
METRIC RATING
189th/ 347
METRIC RANK
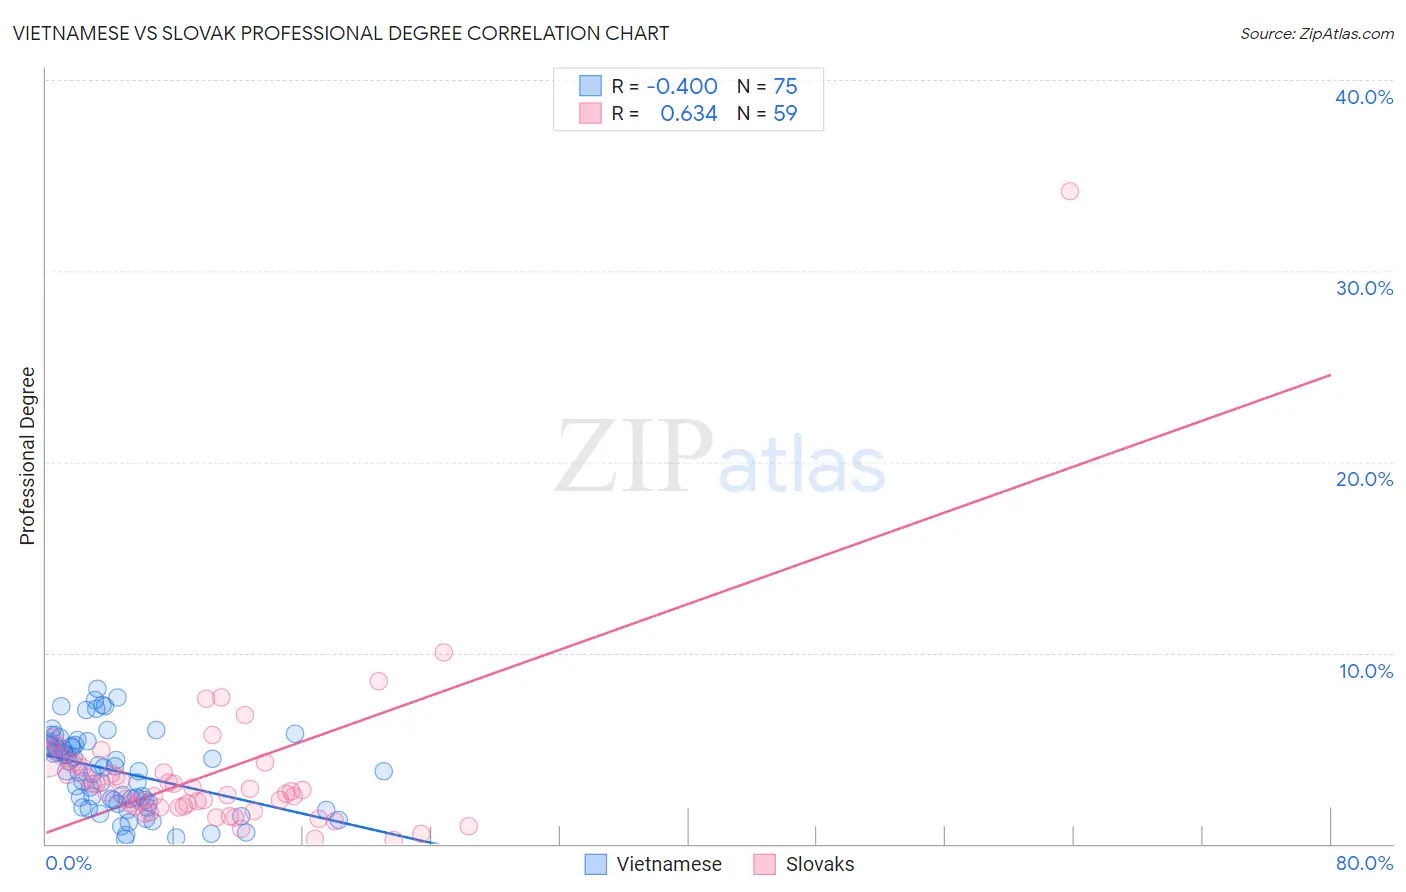
Vietnamese vs Slovak Professional Degree Correlation Chart
The statistical analysis conducted on geographies consisting of 170,674,020 people shows a moderate negative correlation between the proportion of Vietnamese and percentage of population with at least professional degree education in the United States with a correlation coefficient (R) of -0.400 and weighted average of 4.5%. Similarly, the statistical analysis conducted on geographies consisting of 396,603,912 people shows a significant positive correlation between the proportion of Slovaks and percentage of population with at least professional degree education in the United States with a correlation coefficient (R) of 0.634 and weighted average of 4.3%, a difference of 5.9%.
Professional Degree Correlation Summary
| Measurement | Vietnamese | Slovak |
| Minimum | 0.26% | 0.17% |
| Maximum | 8.1% | 34.2% |
| Range | 7.9% | 34.0% |
| Mean | 3.8% | 3.7% |
| Median | 3.8% | 2.8% |
| Interquartile 25% (IQ1) | 2.2% | 1.9% |
| Interquartile 75% (IQ3) | 5.1% | 4.2% |
| Interquartile Range (IQR) | 3.0% | 2.3% |
| Standard Deviation (Sample) | 2.0% | 4.5% |
| Standard Deviation (Population) | 2.0% | 4.5% |
Similar Demographics by Professional Degree
Demographics Similar to Vietnamese by Professional Degree
In terms of professional degree, the demographic groups most similar to Vietnamese are Immigrants from Senegal (4.5%, a difference of 0.060%), Immigrants from Armenia (4.5%, a difference of 0.080%), Assyrian/Chaldean/Syriac (4.5%, a difference of 0.16%), Iraqi (4.5%, a difference of 0.24%), and Swedish (4.5%, a difference of 0.26%).
| Demographics | Rating | Rank | Professional Degree |
| Immigrants | Africa | 72.5 /100 | #152 | Good 4.6% |
| Immigrants | Uruguay | 72.5 /100 | #153 | Good 4.6% |
| Scottish | 71.8 /100 | #154 | Good 4.6% |
| Slavs | 70.8 /100 | #155 | Good 4.5% |
| Swedes | 69.9 /100 | #156 | Good 4.5% |
| Iraqis | 69.8 /100 | #157 | Good 4.5% |
| Immigrants | Armenia | 68.8 /100 | #158 | Good 4.5% |
| Vietnamese | 68.4 /100 | #159 | Good 4.5% |
| Immigrants | Senegal | 68.0 /100 | #160 | Good 4.5% |
| Assyrians/Chaldeans/Syriacs | 67.4 /100 | #161 | Good 4.5% |
| Peruvians | 65.2 /100 | #162 | Good 4.5% |
| Sierra Leoneans | 64.3 /100 | #163 | Good 4.5% |
| Swiss | 61.0 /100 | #164 | Good 4.5% |
| Costa Ricans | 59.9 /100 | #165 | Average 4.5% |
| Immigrants | Colombia | 59.4 /100 | #166 | Average 4.5% |
Demographics Similar to Slovaks by Professional Degree
In terms of professional degree, the demographic groups most similar to Slovaks are Immigrants from Thailand (4.3%, a difference of 0.17%), Immigrants from Poland (4.3%, a difference of 0.26%), Sri Lankan (4.3%, a difference of 0.30%), Immigrants from Cameroon (4.3%, a difference of 0.45%), and Scotch-Irish (4.3%, a difference of 0.60%).
| Demographics | Rating | Rank | Professional Degree |
| Immigrants | Immigrants | 43.2 /100 | #182 | Average 4.4% |
| Bermudans | 43.1 /100 | #183 | Average 4.4% |
| Belgians | 36.2 /100 | #184 | Fair 4.3% |
| Welsh | 35.8 /100 | #185 | Fair 4.3% |
| Scotch-Irish | 34.2 /100 | #186 | Fair 4.3% |
| Immigrants | Cameroon | 33.3 /100 | #187 | Fair 4.3% |
| Immigrants | Thailand | 31.7 /100 | #188 | Fair 4.3% |
| Slovaks | 30.7 /100 | #189 | Fair 4.3% |
| Immigrants | Poland | 29.2 /100 | #190 | Fair 4.3% |
| Sri Lankans | 29.0 /100 | #191 | Fair 4.3% |
| Ghanaians | 27.3 /100 | #192 | Fair 4.3% |
| French | 27.1 /100 | #193 | Fair 4.2% |
| Scandinavians | 25.8 /100 | #194 | Fair 4.2% |
| Nigerians | 24.6 /100 | #195 | Fair 4.2% |
| Spanish | 23.0 /100 | #196 | Fair 4.2% |