Vietnamese vs Immigrants from Grenada Professional Degree
COMPARE
Vietnamese
Immigrants from Grenada
Professional Degree
Professional Degree Comparison
Vietnamese
Immigrants from Grenada
4.5%
PROFESSIONAL DEGREE
68.4/ 100
METRIC RATING
159th/ 347
METRIC RANK
3.7%
PROFESSIONAL DEGREE
1.5/ 100
METRIC RATING
249th/ 347
METRIC RANK
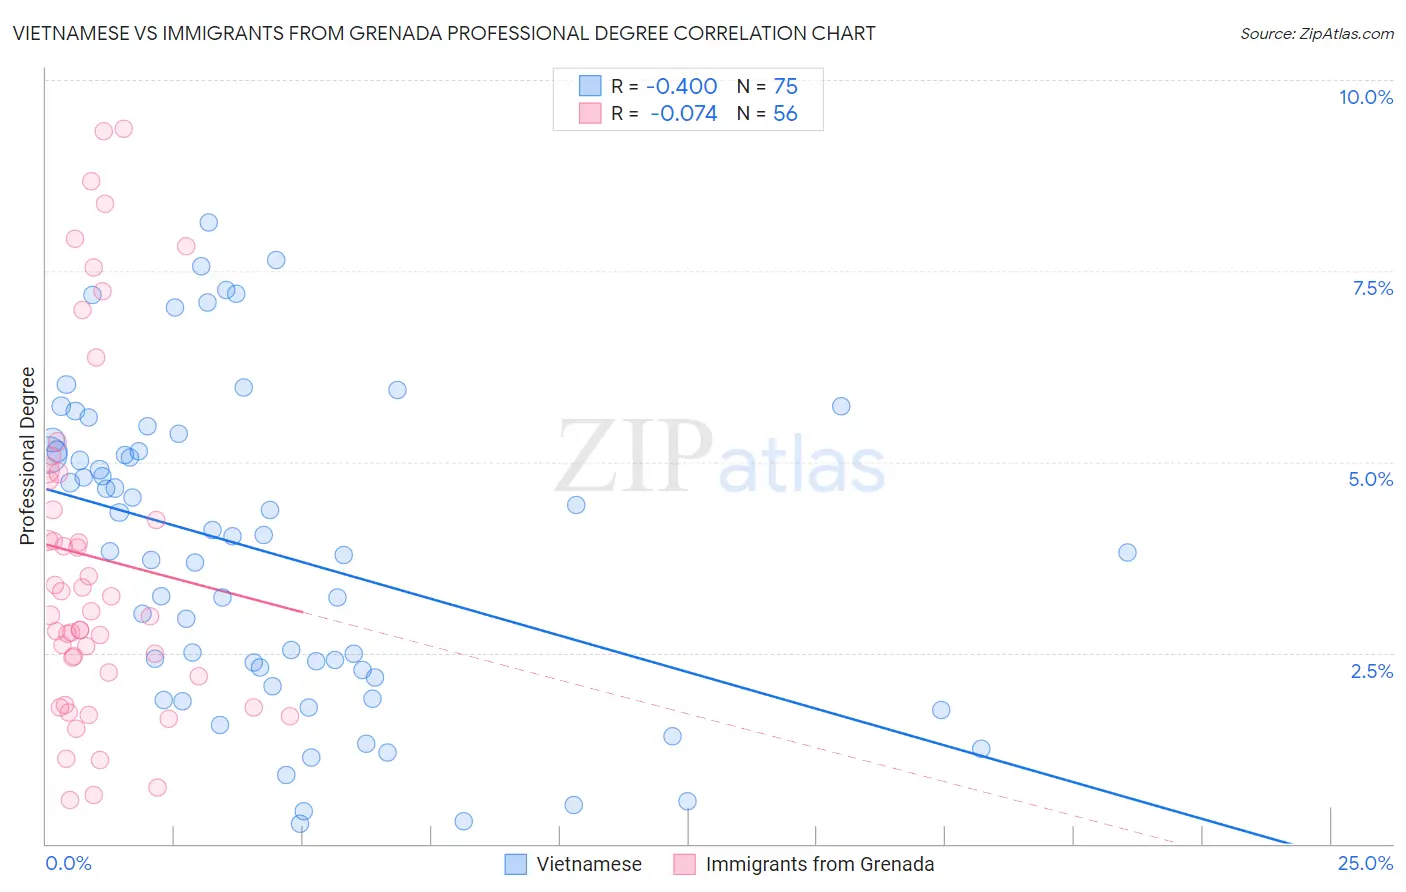
Vietnamese vs Immigrants from Grenada Professional Degree Correlation Chart
The statistical analysis conducted on geographies consisting of 170,674,020 people shows a moderate negative correlation between the proportion of Vietnamese and percentage of population with at least professional degree education in the United States with a correlation coefficient (R) of -0.400 and weighted average of 4.5%. Similarly, the statistical analysis conducted on geographies consisting of 67,193,029 people shows a slight negative correlation between the proportion of Immigrants from Grenada and percentage of population with at least professional degree education in the United States with a correlation coefficient (R) of -0.074 and weighted average of 3.7%, a difference of 21.1%.
Professional Degree Correlation Summary
| Measurement | Vietnamese | Immigrants from Grenada |
| Minimum | 0.26% | 0.57% |
| Maximum | 8.1% | 9.4% |
| Range | 7.9% | 8.8% |
| Mean | 3.8% | 3.7% |
| Median | 3.8% | 3.0% |
| Interquartile 25% (IQ1) | 2.2% | 2.2% |
| Interquartile 75% (IQ3) | 5.1% | 4.8% |
| Interquartile Range (IQR) | 3.0% | 2.6% |
| Standard Deviation (Sample) | 2.0% | 2.3% |
| Standard Deviation (Population) | 2.0% | 2.3% |
Similar Demographics by Professional Degree
Demographics Similar to Vietnamese by Professional Degree
In terms of professional degree, the demographic groups most similar to Vietnamese are Immigrants from Senegal (4.5%, a difference of 0.060%), Immigrants from Armenia (4.5%, a difference of 0.080%), Assyrian/Chaldean/Syriac (4.5%, a difference of 0.16%), Iraqi (4.5%, a difference of 0.24%), and Swedish (4.5%, a difference of 0.26%).
| Demographics | Rating | Rank | Professional Degree |
| Immigrants | Africa | 72.5 /100 | #152 | Good 4.6% |
| Immigrants | Uruguay | 72.5 /100 | #153 | Good 4.6% |
| Scottish | 71.8 /100 | #154 | Good 4.6% |
| Slavs | 70.8 /100 | #155 | Good 4.5% |
| Swedes | 69.9 /100 | #156 | Good 4.5% |
| Iraqis | 69.8 /100 | #157 | Good 4.5% |
| Immigrants | Armenia | 68.8 /100 | #158 | Good 4.5% |
| Vietnamese | 68.4 /100 | #159 | Good 4.5% |
| Immigrants | Senegal | 68.0 /100 | #160 | Good 4.5% |
| Assyrians/Chaldeans/Syriacs | 67.4 /100 | #161 | Good 4.5% |
| Peruvians | 65.2 /100 | #162 | Good 4.5% |
| Sierra Leoneans | 64.3 /100 | #163 | Good 4.5% |
| Swiss | 61.0 /100 | #164 | Good 4.5% |
| Costa Ricans | 59.9 /100 | #165 | Average 4.5% |
| Immigrants | Colombia | 59.4 /100 | #166 | Average 4.5% |
Demographics Similar to Immigrants from Grenada by Professional Degree
In terms of professional degree, the demographic groups most similar to Immigrants from Grenada are Immigrants from Fiji (3.7%, a difference of 0.060%), Hmong (3.7%, a difference of 0.11%), Guyanese (3.8%, a difference of 0.27%), Marshallese (3.8%, a difference of 0.30%), and Immigrants from Nicaragua (3.7%, a difference of 0.31%).
| Demographics | Rating | Rank | Professional Degree |
| Native Hawaiians | 2.3 /100 | #242 | Tragic 3.8% |
| Guamanians/Chamorros | 2.2 /100 | #243 | Tragic 3.8% |
| Immigrants | Bahamas | 2.0 /100 | #244 | Tragic 3.8% |
| French American Indians | 1.7 /100 | #245 | Tragic 3.8% |
| Marshallese | 1.7 /100 | #246 | Tragic 3.8% |
| Guyanese | 1.6 /100 | #247 | Tragic 3.8% |
| Hmong | 1.6 /100 | #248 | Tragic 3.7% |
| Immigrants | Grenada | 1.5 /100 | #249 | Tragic 3.7% |
| Immigrants | Fiji | 1.5 /100 | #250 | Tragic 3.7% |
| Immigrants | Nicaragua | 1.4 /100 | #251 | Tragic 3.7% |
| Jamaicans | 1.4 /100 | #252 | Tragic 3.7% |
| Pueblo | 1.4 /100 | #253 | Tragic 3.7% |
| Tongans | 1.3 /100 | #254 | Tragic 3.7% |
| Osage | 1.2 /100 | #255 | Tragic 3.7% |
| Iroquois | 1.2 /100 | #256 | Tragic 3.7% |