Filipino vs Immigrants from Venezuela Professional Degree
COMPARE
Filipino
Immigrants from Venezuela
Professional Degree
Professional Degree Comparison
Filipinos
Immigrants from Venezuela
7.6%
PROFESSIONAL DEGREE
100.0/ 100
METRIC RATING
4th/ 347
METRIC RANK
4.8%
PROFESSIONAL DEGREE
93.8/ 100
METRIC RATING
123rd/ 347
METRIC RANK
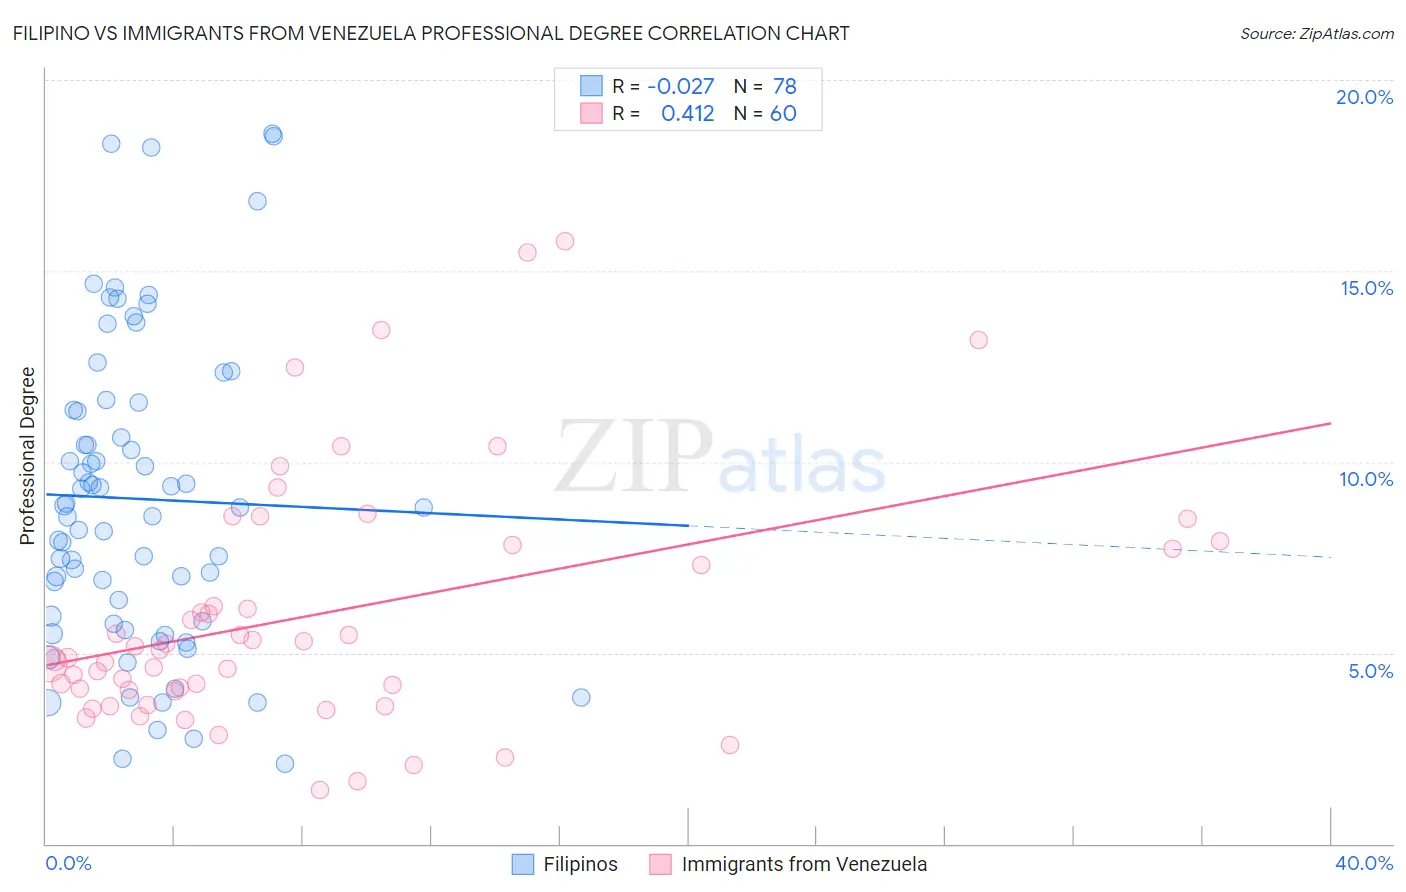
Filipino vs Immigrants from Venezuela Professional Degree Correlation Chart
The statistical analysis conducted on geographies consisting of 254,169,357 people shows no correlation between the proportion of Filipinos and percentage of population with at least professional degree education in the United States with a correlation coefficient (R) of -0.027 and weighted average of 7.6%. Similarly, the statistical analysis conducted on geographies consisting of 287,618,886 people shows a moderate positive correlation between the proportion of Immigrants from Venezuela and percentage of population with at least professional degree education in the United States with a correlation coefficient (R) of 0.412 and weighted average of 4.8%, a difference of 56.2%.
Professional Degree Correlation Summary
| Measurement | Filipino | Immigrants from Venezuela |
| Minimum | 2.1% | 1.4% |
| Maximum | 18.6% | 15.8% |
| Range | 16.5% | 14.4% |
| Mean | 9.0% | 6.0% |
| Median | 8.8% | 5.0% |
| Interquartile 25% (IQ1) | 5.8% | 4.0% |
| Interquartile 75% (IQ3) | 11.4% | 7.8% |
| Interquartile Range (IQR) | 5.5% | 3.8% |
| Standard Deviation (Sample) | 4.0% | 3.3% |
| Standard Deviation (Population) | 4.0% | 3.2% |
Similar Demographics by Professional Degree
Demographics Similar to Filipinos by Professional Degree
In terms of professional degree, the demographic groups most similar to Filipinos are Iranian (7.6%, a difference of 0.77%), Immigrants from Singapore (7.7%, a difference of 2.4%), Immigrants from Iran (7.3%, a difference of 3.2%), Okinawan (7.3%, a difference of 3.4%), and Immigrants from Israel (7.9%, a difference of 3.9%).
| Demographics | Rating | Rank | Professional Degree |
| Immigrants | Israel | 100.0 /100 | #1 | Exceptional 7.9% |
| Immigrants | Singapore | 100.0 /100 | #2 | Exceptional 7.7% |
| Iranians | 100.0 /100 | #3 | Exceptional 7.6% |
| Filipinos | 100.0 /100 | #4 | Exceptional 7.6% |
| Immigrants | Iran | 100.0 /100 | #5 | Exceptional 7.3% |
| Okinawans | 100.0 /100 | #6 | Exceptional 7.3% |
| Eastern Europeans | 100.0 /100 | #7 | Exceptional 7.1% |
| Immigrants | Switzerland | 100.0 /100 | #8 | Exceptional 7.1% |
| Immigrants | Taiwan | 100.0 /100 | #9 | Exceptional 7.1% |
| Immigrants | Belgium | 100.0 /100 | #10 | Exceptional 7.0% |
| Cypriots | 100.0 /100 | #11 | Exceptional 6.9% |
| Israelis | 100.0 /100 | #12 | Exceptional 6.9% |
| Immigrants | Australia | 100.0 /100 | #13 | Exceptional 6.9% |
| Immigrants | France | 100.0 /100 | #14 | Exceptional 6.8% |
| Immigrants | China | 100.0 /100 | #15 | Exceptional 6.7% |
Demographics Similar to Immigrants from Venezuela by Professional Degree
In terms of professional degree, the demographic groups most similar to Immigrants from Venezuela are Immigrants from Germany (4.9%, a difference of 0.17%), Immigrants from Eritrea (4.8%, a difference of 0.18%), Immigrants from Albania (4.8%, a difference of 0.31%), European (4.8%, a difference of 0.36%), and Immigrants from Moldova (4.9%, a difference of 0.63%).
| Demographics | Rating | Rank | Professional Degree |
| Venezuelans | 96.3 /100 | #116 | Exceptional 4.9% |
| Immigrants | Syria | 96.0 /100 | #117 | Exceptional 4.9% |
| Croatians | 96.0 /100 | #118 | Exceptional 4.9% |
| Immigrants | Sudan | 95.4 /100 | #119 | Exceptional 4.9% |
| Albanians | 95.3 /100 | #120 | Exceptional 4.9% |
| Immigrants | Moldova | 94.8 /100 | #121 | Exceptional 4.9% |
| Immigrants | Germany | 94.1 /100 | #122 | Exceptional 4.9% |
| Immigrants | Venezuela | 93.8 /100 | #123 | Exceptional 4.8% |
| Immigrants | Eritrea | 93.5 /100 | #124 | Exceptional 4.8% |
| Immigrants | Albania | 93.3 /100 | #125 | Exceptional 4.8% |
| Europeans | 93.2 /100 | #126 | Exceptional 4.8% |
| Serbians | 92.6 /100 | #127 | Exceptional 4.8% |
| Immigrants | Eastern Africa | 92.5 /100 | #128 | Exceptional 4.8% |
| Palestinians | 91.5 /100 | #129 | Exceptional 4.8% |
| Icelanders | 91.5 /100 | #130 | Exceptional 4.8% |