Vietnamese vs Sudanese Professional Degree
COMPARE
Vietnamese
Sudanese
Professional Degree
Professional Degree Comparison
Vietnamese
Sudanese
4.5%
PROFESSIONAL DEGREE
68.4/ 100
METRIC RATING
159th/ 347
METRIC RANK
4.6%
PROFESSIONAL DEGREE
81.3/ 100
METRIC RATING
142nd/ 347
METRIC RANK
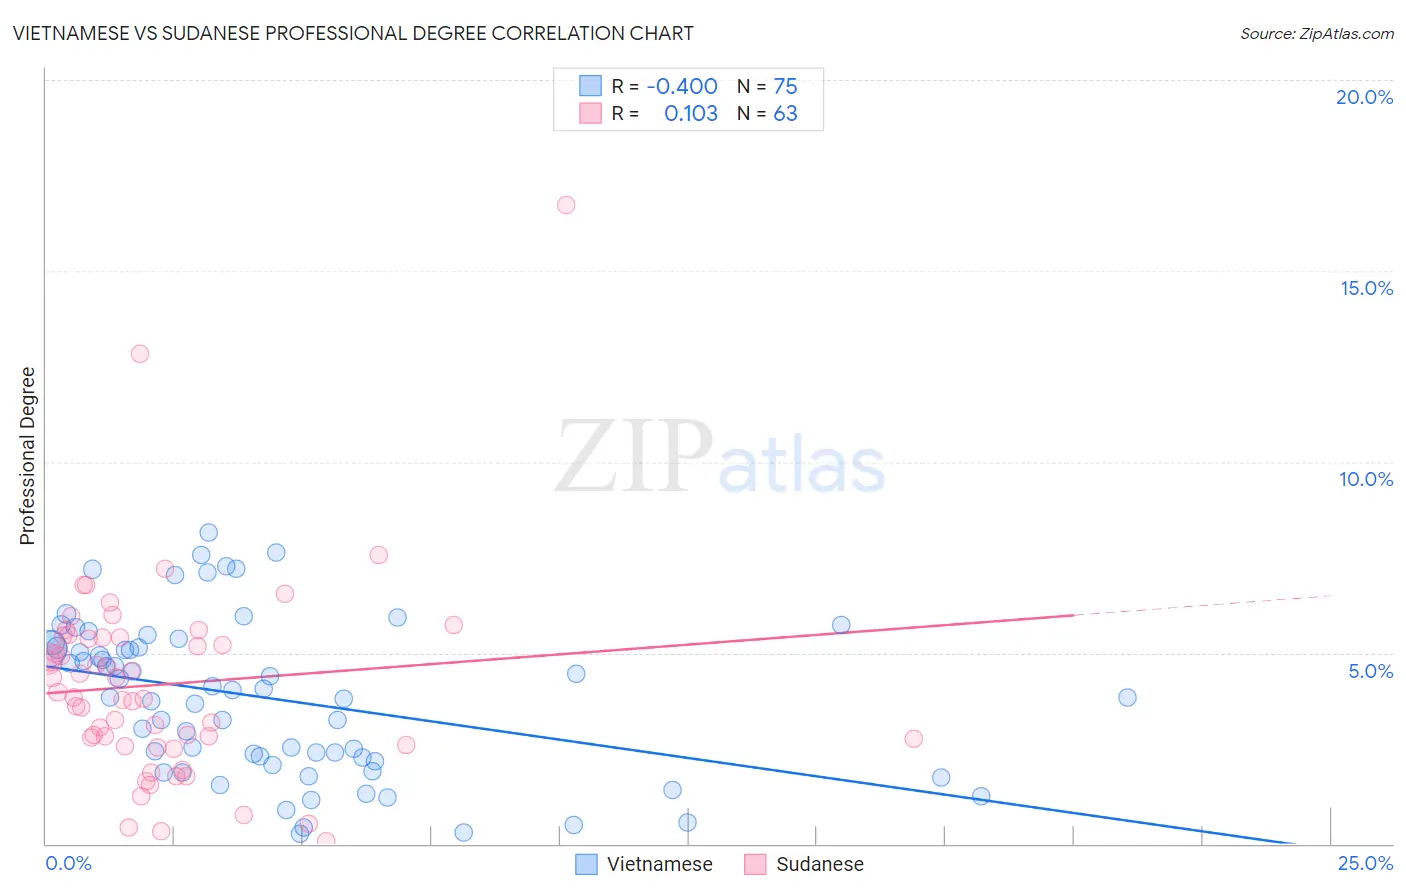
Vietnamese vs Sudanese Professional Degree Correlation Chart
The statistical analysis conducted on geographies consisting of 170,674,020 people shows a moderate negative correlation between the proportion of Vietnamese and percentage of population with at least professional degree education in the United States with a correlation coefficient (R) of -0.400 and weighted average of 4.5%. Similarly, the statistical analysis conducted on geographies consisting of 110,066,536 people shows a poor positive correlation between the proportion of Sudanese and percentage of population with at least professional degree education in the United States with a correlation coefficient (R) of 0.103 and weighted average of 4.6%, a difference of 2.5%.
Professional Degree Correlation Summary
| Measurement | Vietnamese | Sudanese |
| Minimum | 0.26% | 0.061% |
| Maximum | 8.1% | 16.7% |
| Range | 7.9% | 16.7% |
| Mean | 3.8% | 4.2% |
| Median | 3.8% | 3.8% |
| Interquartile 25% (IQ1) | 2.2% | 2.6% |
| Interquartile 75% (IQ3) | 5.1% | 5.4% |
| Interquartile Range (IQR) | 3.0% | 2.8% |
| Standard Deviation (Sample) | 2.0% | 2.7% |
| Standard Deviation (Population) | 2.0% | 2.7% |
Demographics Similar to Vietnamese and Sudanese by Professional Degree
In terms of professional degree, the demographic groups most similar to Vietnamese are Immigrants from Senegal (4.5%, a difference of 0.060%), Immigrants from Armenia (4.5%, a difference of 0.080%), Iraqi (4.5%, a difference of 0.24%), Swedish (4.5%, a difference of 0.26%), and Slavic (4.5%, a difference of 0.41%). Similarly, the demographic groups most similar to Sudanese are Hungarian (4.6%, a difference of 0.11%), Basque (4.6%, a difference of 0.13%), Immigrants from South America (4.6%, a difference of 0.18%), Uruguayan (4.6%, a difference of 0.24%), and Luxembourger (4.6%, a difference of 0.55%).
| Demographics | Rating | Rank | Professional Degree |
| Canadians | 84.4 /100 | #140 | Excellent 4.7% |
| Basques | 81.8 /100 | #141 | Excellent 4.6% |
| Sudanese | 81.3 /100 | #142 | Excellent 4.6% |
| Hungarians | 80.8 /100 | #143 | Excellent 4.6% |
| Immigrants | South America | 80.5 /100 | #144 | Excellent 4.6% |
| Uruguayans | 80.2 /100 | #145 | Excellent 4.6% |
| Luxembourgers | 78.7 /100 | #146 | Good 4.6% |
| Colombians | 77.7 /100 | #147 | Good 4.6% |
| Slovenes | 76.1 /100 | #148 | Good 4.6% |
| Senegalese | 75.3 /100 | #149 | Good 4.6% |
| Immigrants | Oceania | 73.4 /100 | #150 | Good 4.6% |
| Poles | 72.6 /100 | #151 | Good 4.6% |
| Immigrants | Africa | 72.5 /100 | #152 | Good 4.6% |
| Immigrants | Uruguay | 72.5 /100 | #153 | Good 4.6% |
| Scottish | 71.8 /100 | #154 | Good 4.6% |
| Slavs | 70.8 /100 | #155 | Good 4.5% |
| Swedes | 69.9 /100 | #156 | Good 4.5% |
| Iraqis | 69.8 /100 | #157 | Good 4.5% |
| Immigrants | Armenia | 68.8 /100 | #158 | Good 4.5% |
| Vietnamese | 68.4 /100 | #159 | Good 4.5% |
| Immigrants | Senegal | 68.0 /100 | #160 | Good 4.5% |