Ute vs Immigrants from Venezuela Professional Degree
COMPARE
Ute
Immigrants from Venezuela
Professional Degree
Professional Degree Comparison
Ute
Immigrants from Venezuela
4.0%
PROFESSIONAL DEGREE
8.2/ 100
METRIC RATING
220th/ 347
METRIC RANK
4.8%
PROFESSIONAL DEGREE
93.8/ 100
METRIC RATING
123rd/ 347
METRIC RANK
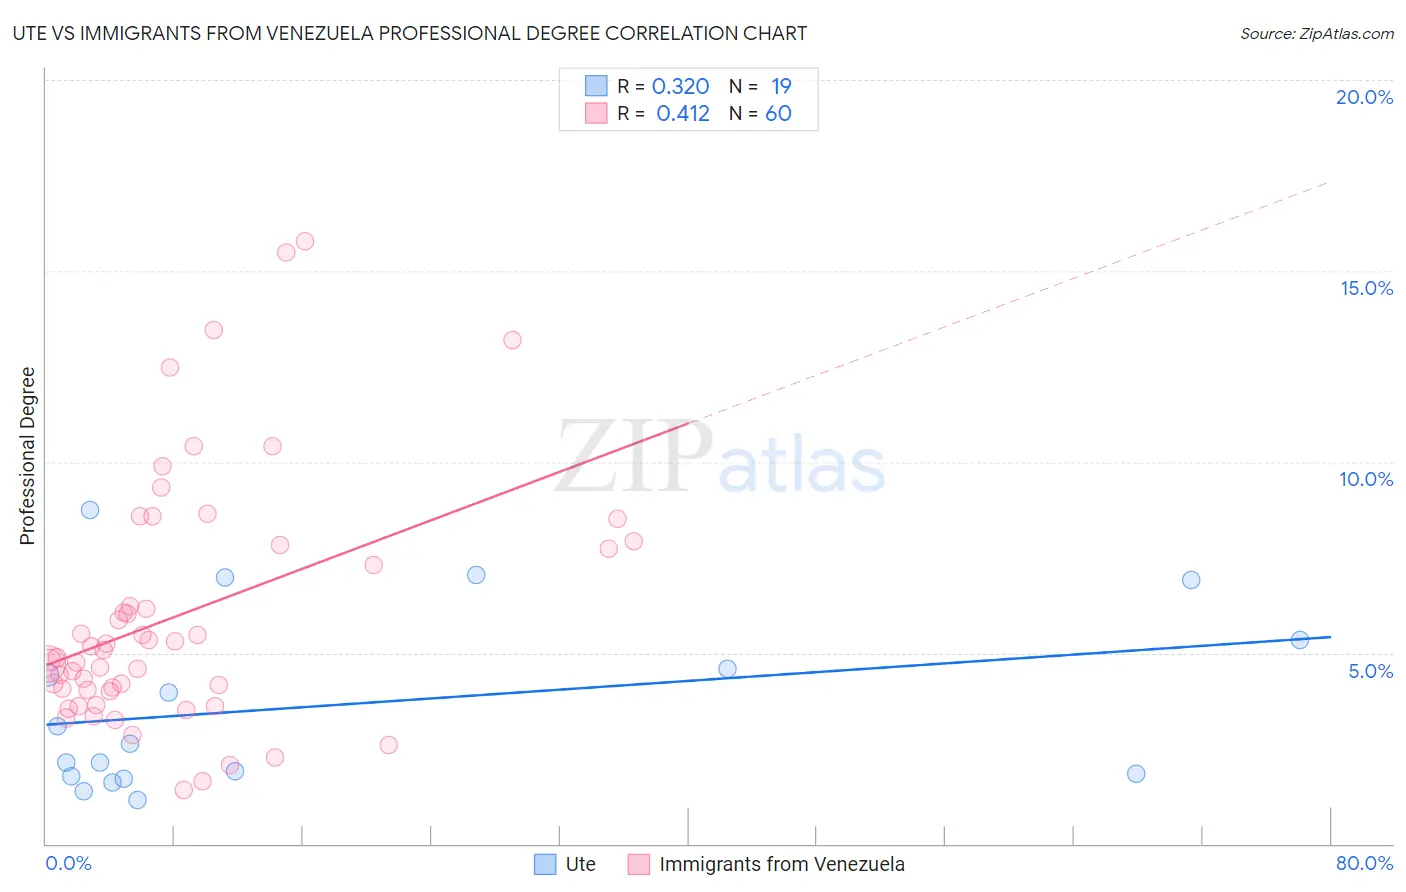
Ute vs Immigrants from Venezuela Professional Degree Correlation Chart
The statistical analysis conducted on geographies consisting of 55,594,761 people shows a mild positive correlation between the proportion of Ute and percentage of population with at least professional degree education in the United States with a correlation coefficient (R) of 0.320 and weighted average of 4.0%. Similarly, the statistical analysis conducted on geographies consisting of 287,618,886 people shows a moderate positive correlation between the proportion of Immigrants from Venezuela and percentage of population with at least professional degree education in the United States with a correlation coefficient (R) of 0.412 and weighted average of 4.8%, a difference of 20.5%.
Professional Degree Correlation Summary
| Measurement | Ute | Immigrants from Venezuela |
| Minimum | 1.1% | 1.4% |
| Maximum | 8.7% | 15.8% |
| Range | 7.6% | 14.4% |
| Mean | 3.6% | 6.0% |
| Median | 2.6% | 5.0% |
| Interquartile 25% (IQ1) | 1.8% | 4.0% |
| Interquartile 75% (IQ3) | 5.3% | 7.8% |
| Interquartile Range (IQR) | 3.6% | 3.8% |
| Standard Deviation (Sample) | 2.3% | 3.3% |
| Standard Deviation (Population) | 2.3% | 3.2% |
Similar Demographics by Professional Degree
Demographics Similar to Ute by Professional Degree
In terms of professional degree, the demographic groups most similar to Ute are French Canadian (4.0%, a difference of 0.13%), Immigrants from South Eastern Asia (4.0%, a difference of 0.35%), Immigrants from Western Africa (4.0%, a difference of 0.38%), Dutch (4.0%, a difference of 0.39%), and Immigrants from Bosnia and Herzegovina (4.0%, a difference of 0.46%).
| Demographics | Rating | Rank | Professional Degree |
| Koreans | 10.7 /100 | #213 | Poor 4.1% |
| Immigrants | Ghana | 10.6 /100 | #214 | Poor 4.1% |
| Portuguese | 10.5 /100 | #215 | Poor 4.1% |
| West Indians | 9.8 /100 | #216 | Tragic 4.1% |
| Immigrants | Vietnam | 9.4 /100 | #217 | Tragic 4.0% |
| Dutch | 9.0 /100 | #218 | Tragic 4.0% |
| Immigrants | South Eastern Asia | 8.9 /100 | #219 | Tragic 4.0% |
| Ute | 8.2 /100 | #220 | Tragic 4.0% |
| French Canadians | 8.0 /100 | #221 | Tragic 4.0% |
| Immigrants | Western Africa | 7.5 /100 | #222 | Tragic 4.0% |
| Immigrants | Bosnia and Herzegovina | 7.4 /100 | #223 | Tragic 4.0% |
| Trinidadians and Tobagonians | 7.1 /100 | #224 | Tragic 4.0% |
| Tlingit-Haida | 6.9 /100 | #225 | Tragic 4.0% |
| German Russians | 6.1 /100 | #226 | Tragic 4.0% |
| Cubans | 5.9 /100 | #227 | Tragic 4.0% |
Demographics Similar to Immigrants from Venezuela by Professional Degree
In terms of professional degree, the demographic groups most similar to Immigrants from Venezuela are Immigrants from Germany (4.9%, a difference of 0.17%), Immigrants from Eritrea (4.8%, a difference of 0.18%), Immigrants from Albania (4.8%, a difference of 0.31%), European (4.8%, a difference of 0.36%), and Immigrants from Moldova (4.9%, a difference of 0.63%).
| Demographics | Rating | Rank | Professional Degree |
| Venezuelans | 96.3 /100 | #116 | Exceptional 4.9% |
| Immigrants | Syria | 96.0 /100 | #117 | Exceptional 4.9% |
| Croatians | 96.0 /100 | #118 | Exceptional 4.9% |
| Immigrants | Sudan | 95.4 /100 | #119 | Exceptional 4.9% |
| Albanians | 95.3 /100 | #120 | Exceptional 4.9% |
| Immigrants | Moldova | 94.8 /100 | #121 | Exceptional 4.9% |
| Immigrants | Germany | 94.1 /100 | #122 | Exceptional 4.9% |
| Immigrants | Venezuela | 93.8 /100 | #123 | Exceptional 4.8% |
| Immigrants | Eritrea | 93.5 /100 | #124 | Exceptional 4.8% |
| Immigrants | Albania | 93.3 /100 | #125 | Exceptional 4.8% |
| Europeans | 93.2 /100 | #126 | Exceptional 4.8% |
| Serbians | 92.6 /100 | #127 | Exceptional 4.8% |
| Immigrants | Eastern Africa | 92.5 /100 | #128 | Exceptional 4.8% |
| Palestinians | 91.5 /100 | #129 | Exceptional 4.8% |
| Icelanders | 91.5 /100 | #130 | Exceptional 4.8% |